Looking east on a clear night, just before sunrise, a glow extends upward from the horizon. This light lingers, coexisting with the stars, before a brighter band of sky appears along the horizon, the Sun itself not far behind. Long exposure photography shows the phenomenon clearly, such as in the left side of the image below (the glow of the Milky Way galaxy is also visible on the right).
Astronomers first noticed the subtle first light, known as zodiacal light, centuries ago. In fact, identifying this phenomenon has been important to the practice of Islam. The fajr, or dawn prayer, is required before sunrise every day, but how long before? Unlike noon and sunset, the time of dawn is harder to pin down precisely.
The phenomenon of zodiacal light was significant enough to be named in the teachings of the Islamic prophet Muhammad: it was called "the false dawn", al-fajr al-kazib, to be distinguished from the later "true dawn", al-fajr as-sadiq. The latter time is widely accepted to be the correct one for the dawn prayer.
But what causes this light? In some ways, the cause is mundane: astronomers have long known that the glow originates from sunlight reflecting off of small dust particles in space. The long-narrow shape of the glow occurs because dust is not distributed uniformly throughout interplanetary space. Nearly all objects orbiting the Sun, from the largest planets to the smallest dust particles, cluster near a single plane, the plane of the Solar System. In our night sky, this plane appears as a line known as the ecliptic, along which the planets, Sun, and Moon travel. In turn, the constellations on the ecliptic are known as the zodiac. Voilà! Zodiacal light! Though most pronounced near the Sun at dawn, dim zodiacal light can be observed on a moonless night to follow the entire ecliptic.
However, this explanation merely raises another question. Where does the dust come from? Some debris comes from comets and asteroids, but some more evidence recently surfaced on this subject from an unlikely source.
On August 5, 2011, the NASA spacecraft Juno launched from Earth, the beginning of its five-year journey to Jupiter. Elsewhere on this blog, I've written in depth about Juno's mission and its many discoveries orbiting the Solar System's largest planet. However, the probe began gathering important data long before reaching its destination. Along its trajectory (pictured above*), Juno returned to Earth for a gravity assist to give it a boost to Jupiter. During its journey, scientists on the Juno team noticed something alarming: thousands of tiny streaks of light appeared on images of what should have been empty space!
Further analysis revealed that the streaks were tiny bits of debris knocked from Juno's solar panels, dislodged by microscopic dust particles impacting at high velocities. Unintentionally, the large solar panels of Juno became a interplanetary dust collector! Fortunately, the impacts were not large enough to cause damage detrimental to the mission, but they did reveal a surprising story.
In all, over 15,000 dust impact events were recorded, enough to measure in unprecendented detail the distribution throughout the inner Solar System. The figure above* (click to enlarge) shows the data. The top panel shows events on Juno's inbound stage from the farthest point of its first orbit (on the trajectory image, the point marked DSM or "Deep Space Manuever") to Earth flyby. The second shows impacts recorded outbound from Earth flyby through the asteroid belt, on its way to Jupiter. The horizontal axis measures distance from the Sun, while the black line indicates frequency of imapct events. For context, various significant distances and the distribution of asteroids (gray) in the asteroid belt are also included.
As a bonus, the outbound portion of the trajectory shown above was tilted from the ecliptic plane, while the inbound one lay within it (see again the trajectory image). Hence, we can clearly see that less impacts occur away from the plane of the Solar System. It is also clear that the impacts are reduced near Earth, since our planet's gravitational influence "clears its orbit" of dust. Nevertheless, it is the dust closest to us that causes most of the zodiacal light we observe.
In contrast, the vicinity of Mars appears riddled with dust, even more so than some parts of the asteroid belt! This was a great surprise, for it was expected most of the dust was from asteroids and that Mars would clear its orbit, just like Earth does. However, further data analysis confirmed that Mars must in fact be a major source of the dust that ultimately causes zodiacal light! There is much more to be discovered about this story: what mechanisms cause Mars to lose so much dust to space? Currently, the answer is not definitively known, though further space missions could provide clues.
But after thousands of years of mystery, at least we now know that when we see that before-dawn glow, we have the red planet to thank.
Sources: https://www.al-islam.org/articles/al-fajr-sadiq-new-perspective-sayyid-muhammad-rizvi, https://earthsky.org/astronomy-essentials/everything-you-need-to-know-zodiacal-light-or-false-dusk/, https://agupubs.onlinelibrary.wiley.com/doi/epdf/10.1029/2020JE006509, https://www.jpl.nasa.gov/news/serendipitous-juno-detections-shatter-ideas-about-origin-of-zodiacal-light
*The last few figures in this post are from the paper "Distribution of Interplanetary Dust Detected by the Juno Spacecraft and Its Contribution to the Zodiacal Light" by J. Jorgensen et al.
Saturday, January 1, 2022
Monday, December 13, 2021
2021 Season Summary
The 2021 Atlantic hurricane season was quite active, with a total of
21 cyclones attaining tropical depression status,
21 cyclones attaining tropical storm status,
7 cyclones attaining hurricane status, and
4 cyclones attaining major hurricane status.
Before the beginning of the season, I predicted that there would be
17 cyclones attaining tropical depression status,
16 cyclones attaining tropical storm status,
8 cyclones attaining hurricane status,
5 cyclones attaining major hurricane status.
The average numbers of tropical storms, hurricanes and major hurricanes (over the 30 year period 1991-2020) were 14.4, 7.2, and 3.2, respectively. This puts the 2021 season a bit above average overall, with a much higher than usual number of named storms but near average numbers of hurricanes and major hurricanes. Likewise, my predictions underestimated the number of named storms, but were close on hurricanes and major hurricanes. The 21 named storms were the third-most recorded for an Atlantic season at the time, behind 2020 and 2005. The Accumulated Cyclone Energy (ACE) value for the 2021 season (which accounts for duration and intensity of storms as well as number) was roughly 145, once again above normal but not by a huge margin. The exact figure will likely shift slightly in post-season analysis.
A bevy of short-lived, weak systems inflated the total number for the season, especially early on. There were three named storms in June for the first time since 1968. Hurricane Elsa set a record for earliest fifth named storm when it was named on July 1. However, the end of the season was surprisingly quiet. With the exception of meandering Tropical Storm Wanda, which spent a week in early November moving around the north Atlantic, there was no activity from October 4 onward. This is quite unusual: on average, one would expect around 3 named storms and at least 1 hurricane during that time. Even stranger, the entire world experienced a lack of strong cyclones during October and November 2021. To explain this behavior, we'll examine a few factors.
At the beginning of the season, an ongoing La Niña event was on the wane, and indeed it officially ended over the summer. However, equatorial Pacific sea temperature anomalies remained negative (consistent with La Niña) and even began to decrease again by late in the year. The relevant regions of the Pacific and their temperature anomalies throughout the year are illustrated above. Overall, the weak La Niña that occurred was consistent with pre-season predictions. It is correlated with lower wind shear in the Atlantic and thus consistent with the somewhat above normal activity observed. Likewise, the tropical north Atlantic had fairly warm ocean temperatures, which helped tropical cyclones to form and intensify. However, this doesn't explain why the Atlantic shut down in October.
2021 featured a particularly strong west African monsoon; note the high precipitation over Africa around 10° N or so between June and August in the map above. This is signficant because tropical waves, the precursors to most Atlantic tropical cyclones, form over Africa and move westward into the Atlantic. Indeed, in contrast to 2020, a larger proportion of storms originated in the tropical Atlantic (see the map of storm tracks below):
Every year, the opportunity for cyclone formation off of Africa closes in early October, when the wave axis shifts toward the equator and east Atlantic temperatures start to get cooler. The center of activity usually then shifts to the Caribbean, but the Caribbean saw an unusual amount of dry sinking air late in the year, stifling any formation. This is again in stark contrast to 2020, when the west Caribbean saw its most active period in recorded history from October through November. These factors help to indicate why the 2021 season ended earlier than expected.
In my predictions, I put the Caribbean islands and the Gulf of Mexico at highest risk, with the U.S. east coast and central America at lower risk. These predictions were fairly good: Hurricane Elsa, Tropical Storm Fred, Hurricane Grace, and Hurricane Ida impacted the Caribbean Islands, while Ida and Hurricane Nicholas had the greatest Gulf impacts (though Grace also hit the Yucatan and the southwest Gulf). The Caribbean impacts might have been greater still had some of the above storms not tracked directly over the greater Antilles. No landfalls occurred in central America and only the extremely unusual Henri had any significant impact on the U.S. east coast as a tropical cyclone.
Some other notable facts or records from 2021 include:
The 2021 season was quite active, though with many weak systems. The vast majority of the season's damage and loss of life were due to Hurricane Ida, which made landfall in Louisiana as a category 4 hurricane.
Sources: https://www.washingtonpost.com/weather/2021/11/22/earth-hurricane-activity-record-quiet/, https://www.cpc.ncep.noaa.gov/products/analysis_monitoring/lanina/enso_evolution-status-fcsts-web.pdf
21 cyclones attaining tropical depression status,
21 cyclones attaining tropical storm status,
7 cyclones attaining hurricane status, and
4 cyclones attaining major hurricane status.
Before the beginning of the season, I predicted that there would be
17 cyclones attaining tropical depression status,
16 cyclones attaining tropical storm status,
8 cyclones attaining hurricane status,
5 cyclones attaining major hurricane status.
The average numbers of tropical storms, hurricanes and major hurricanes (over the 30 year period 1991-2020) were 14.4, 7.2, and 3.2, respectively. This puts the 2021 season a bit above average overall, with a much higher than usual number of named storms but near average numbers of hurricanes and major hurricanes. Likewise, my predictions underestimated the number of named storms, but were close on hurricanes and major hurricanes. The 21 named storms were the third-most recorded for an Atlantic season at the time, behind 2020 and 2005. The Accumulated Cyclone Energy (ACE) value for the 2021 season (which accounts for duration and intensity of storms as well as number) was roughly 145, once again above normal but not by a huge margin. The exact figure will likely shift slightly in post-season analysis.
A bevy of short-lived, weak systems inflated the total number for the season, especially early on. There were three named storms in June for the first time since 1968. Hurricane Elsa set a record for earliest fifth named storm when it was named on July 1. However, the end of the season was surprisingly quiet. With the exception of meandering Tropical Storm Wanda, which spent a week in early November moving around the north Atlantic, there was no activity from October 4 onward. This is quite unusual: on average, one would expect around 3 named storms and at least 1 hurricane during that time. Even stranger, the entire world experienced a lack of strong cyclones during October and November 2021. To explain this behavior, we'll examine a few factors.
At the beginning of the season, an ongoing La Niña event was on the wane, and indeed it officially ended over the summer. However, equatorial Pacific sea temperature anomalies remained negative (consistent with La Niña) and even began to decrease again by late in the year. The relevant regions of the Pacific and their temperature anomalies throughout the year are illustrated above. Overall, the weak La Niña that occurred was consistent with pre-season predictions. It is correlated with lower wind shear in the Atlantic and thus consistent with the somewhat above normal activity observed. Likewise, the tropical north Atlantic had fairly warm ocean temperatures, which helped tropical cyclones to form and intensify. However, this doesn't explain why the Atlantic shut down in October.
2021 featured a particularly strong west African monsoon; note the high precipitation over Africa around 10° N or so between June and August in the map above. This is signficant because tropical waves, the precursors to most Atlantic tropical cyclones, form over Africa and move westward into the Atlantic. Indeed, in contrast to 2020, a larger proportion of storms originated in the tropical Atlantic (see the map of storm tracks below):
Every year, the opportunity for cyclone formation off of Africa closes in early October, when the wave axis shifts toward the equator and east Atlantic temperatures start to get cooler. The center of activity usually then shifts to the Caribbean, but the Caribbean saw an unusual amount of dry sinking air late in the year, stifling any formation. This is again in stark contrast to 2020, when the west Caribbean saw its most active period in recorded history from October through November. These factors help to indicate why the 2021 season ended earlier than expected.
In my predictions, I put the Caribbean islands and the Gulf of Mexico at highest risk, with the U.S. east coast and central America at lower risk. These predictions were fairly good: Hurricane Elsa, Tropical Storm Fred, Hurricane Grace, and Hurricane Ida impacted the Caribbean Islands, while Ida and Hurricane Nicholas had the greatest Gulf impacts (though Grace also hit the Yucatan and the southwest Gulf). The Caribbean impacts might have been greater still had some of the above storms not tracked directly over the greater Antilles. No landfalls occurred in central America and only the extremely unusual Henri had any significant impact on the U.S. east coast as a tropical cyclone.
Some other notable facts or records from 2021 include:
- Tropical Storm Ana's formation on May 22 made 2021 the seventh consecutive season with a named storm before June 1
- Elsa was the easternmost forming early July hurricane in the tropics since 1933; it also had the highest forward speed of any known Atlantic hurricane in the tropics
- Grace's remnants reformed as a tropical storm in the eastern Pacific and were named Marty
- Henri was the slowest-moving cyclone ever recorded in the U.S. northeast; this led to unusual flooding impacts in the region
- Ida tied 2020's Hurricane Laura for highest winds of a landfalling Louisiana hurricane (150 mph)
The 2021 season was quite active, though with many weak systems. The vast majority of the season's damage and loss of life were due to Hurricane Ida, which made landfall in Louisiana as a category 4 hurricane.
Sources: https://www.washingtonpost.com/weather/2021/11/22/earth-hurricane-activity-record-quiet/, https://www.cpc.ncep.noaa.gov/products/analysis_monitoring/lanina/enso_evolution-status-fcsts-web.pdf
Labels:
2021 Storms,
Hurricane Stats
Tuesday, November 2, 2021
Tropical Storm Wanda (2021)
Storm Active: October 30-November 7
On October 25, an early-season nor'easter formed off the United States east coast. The low deepened rapidly over the next day and brought hurricane-force wind gusts to coastal Massachusetts, but it was a non-tropical system. The system meandered near the coast for another day before slowly retreating eastward over the open Atlantic. It remained an intense low for the next several days, but was still attached to a frontal boundary. The low moved turned southeastward on the 27th and pursued that heading for a few days until it encountered warmer waters. Late on the 30th, the cyclone was classified as Subtropical Storm Wanda; it had more central convection and a tighter windfield, but was still interacting with nearby fronts.
After formation, Wanda slowed down and meandered across the open central Atlantic. Meanwhile, the cyclone was separating further from the nearby upper-level low. It transitioned into a fully tropical storm on November 1.
Wanda turned northward and made some steady progress in that direction over the next few days, following a trough to its north. The convective structure remained somewhat subtropical in appearance, with curved bands north and west of the center, but little in the way of deep central convection. However, on November 4, a ridge built to the north of Wanda and turned it back southeastward, in the general direction of the Azores.
By November 6, Wanda began to feel the pull of a powerful cyclone over the north Atlantic. It turned back to the northeast and began to accelerate, passing northwest of the Azores. The cyclone encountered high shear and colder waters and transitioned to an extratropical cyclone on the 7th.
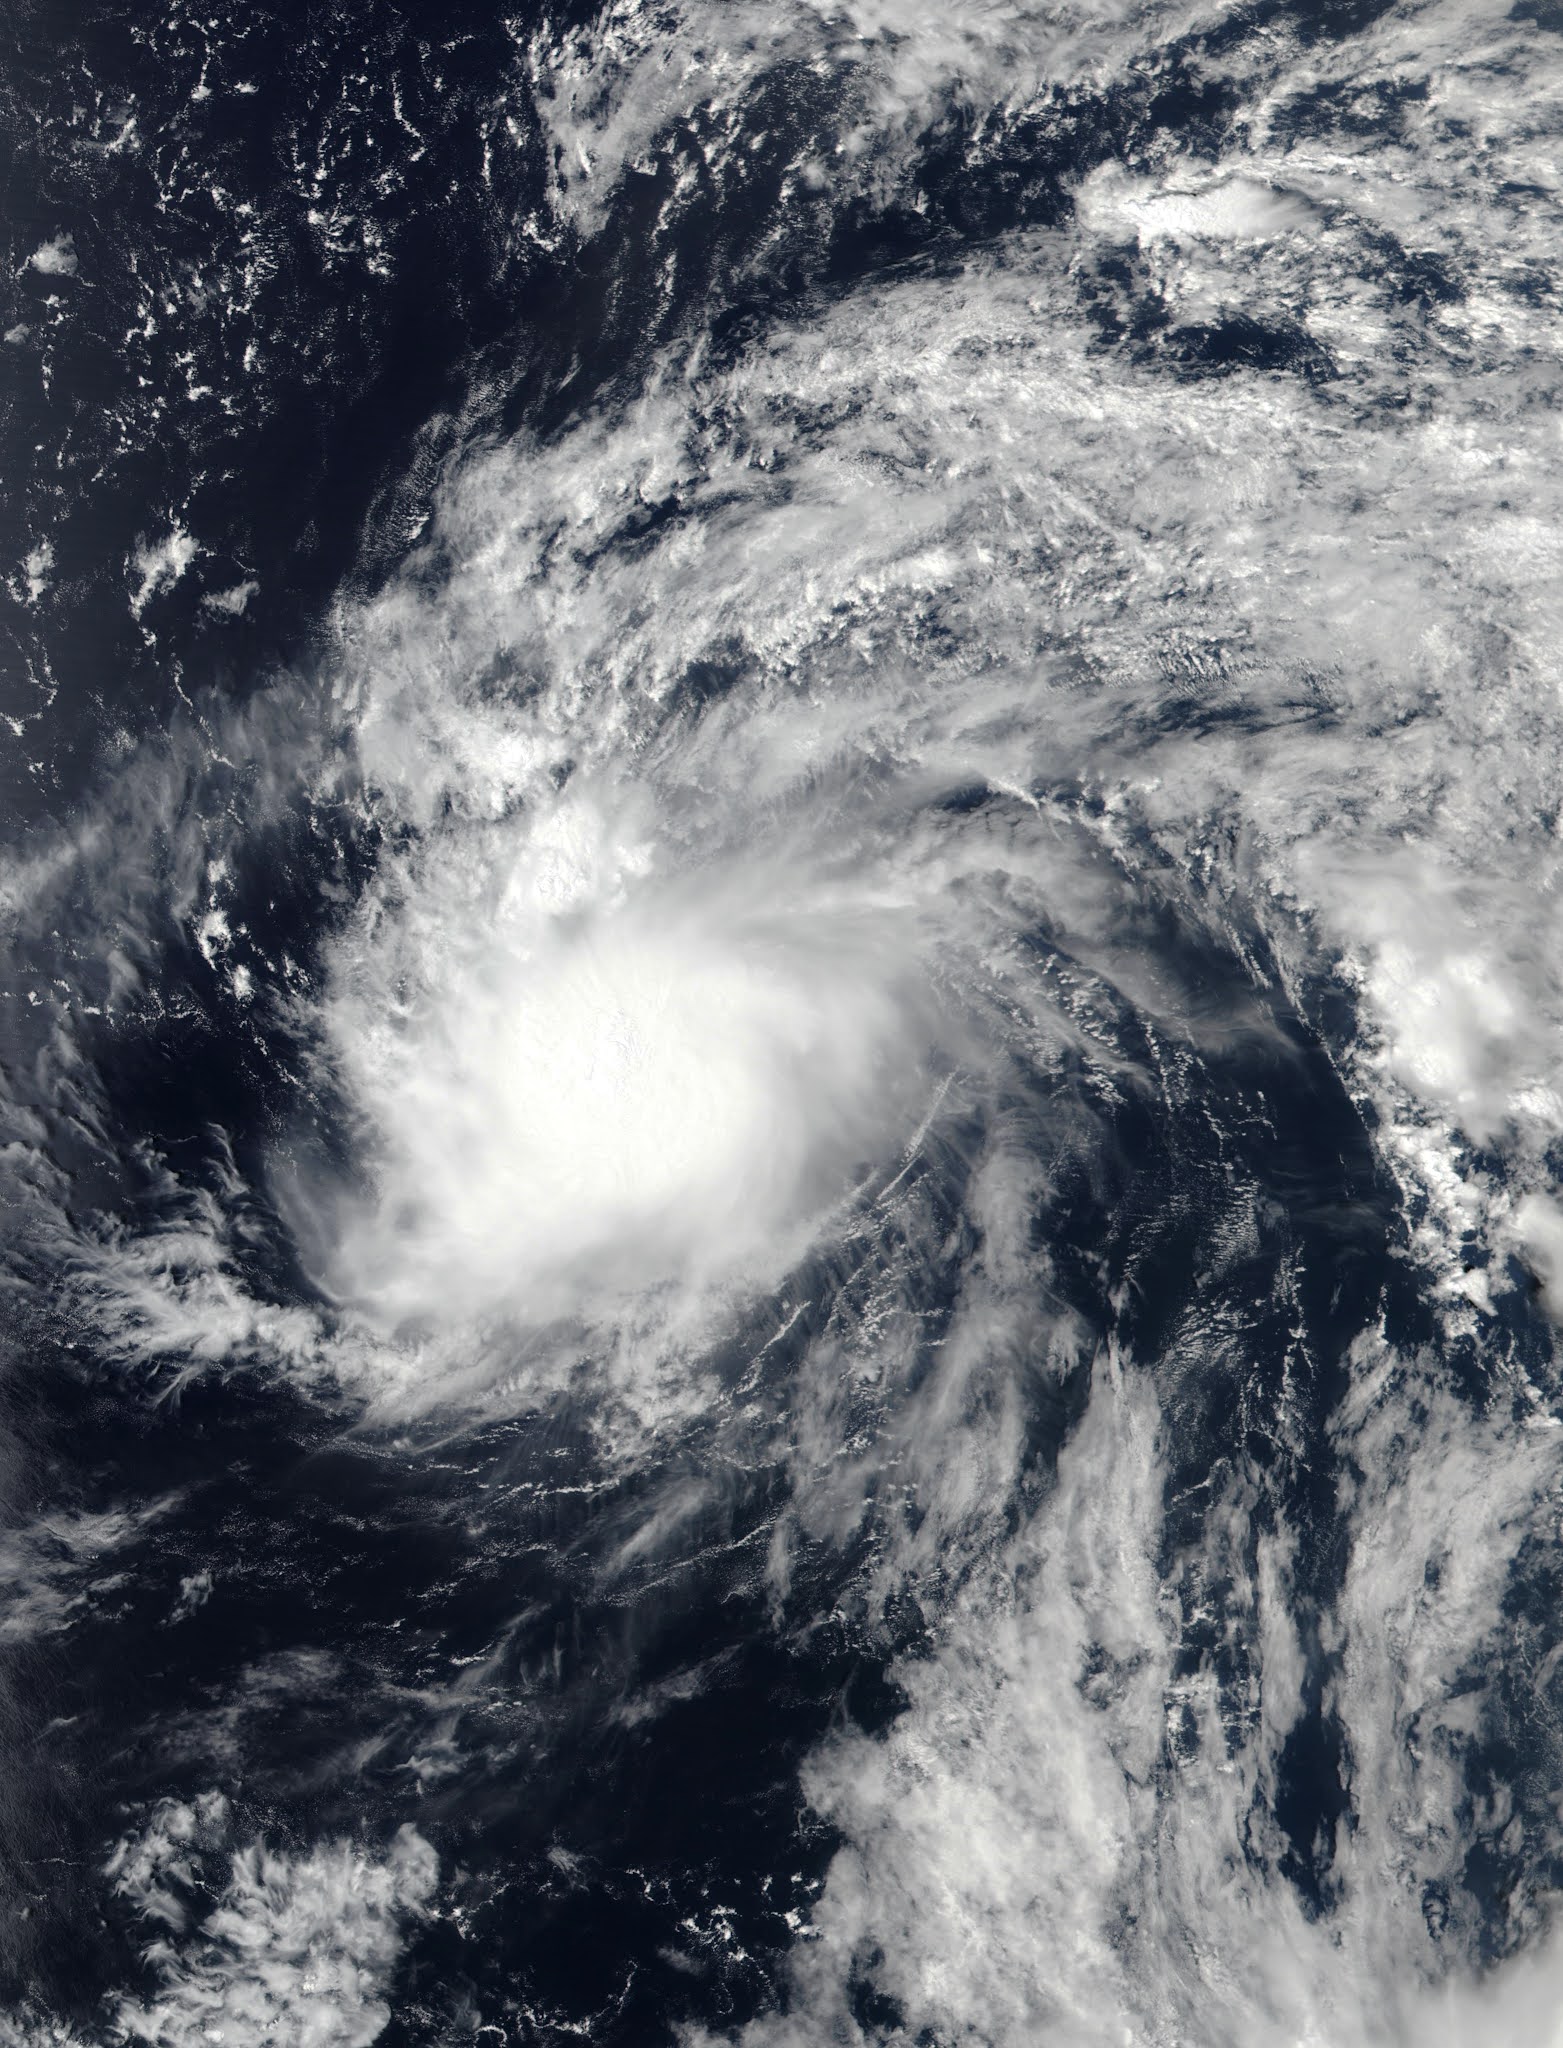
The above image shows Wanda on November 3 over the open Atlantic.
Wanda took a meandering track over the north Atlantic, beginning as an extratropical low near the Eastern seaboard and ending past the Azores.
On October 25, an early-season nor'easter formed off the United States east coast. The low deepened rapidly over the next day and brought hurricane-force wind gusts to coastal Massachusetts, but it was a non-tropical system. The system meandered near the coast for another day before slowly retreating eastward over the open Atlantic. It remained an intense low for the next several days, but was still attached to a frontal boundary. The low moved turned southeastward on the 27th and pursued that heading for a few days until it encountered warmer waters. Late on the 30th, the cyclone was classified as Subtropical Storm Wanda; it had more central convection and a tighter windfield, but was still interacting with nearby fronts.
After formation, Wanda slowed down and meandered across the open central Atlantic. Meanwhile, the cyclone was separating further from the nearby upper-level low. It transitioned into a fully tropical storm on November 1.
Wanda turned northward and made some steady progress in that direction over the next few days, following a trough to its north. The convective structure remained somewhat subtropical in appearance, with curved bands north and west of the center, but little in the way of deep central convection. However, on November 4, a ridge built to the north of Wanda and turned it back southeastward, in the general direction of the Azores.
By November 6, Wanda began to feel the pull of a powerful cyclone over the north Atlantic. It turned back to the northeast and began to accelerate, passing northwest of the Azores. The cyclone encountered high shear and colder waters and transitioned to an extratropical cyclone on the 7th.
The above image shows Wanda on November 3 over the open Atlantic.
Wanda took a meandering track over the north Atlantic, beginning as an extratropical low near the Eastern seaboard and ending past the Azores.
Labels:
2021 Storms
Wednesday, September 29, 2021
Tropical Storm Victor (2021)
Storm Active: September 29-October 4
On September 27, a tropical wave moved off of Africa into the eastern Atlantic. It was located on the eastern edge of a monsoonal trough of low pressure, while another tropical wave was situated on the western end. For a few days, these disturbances battled it out, but the eastern one ultimately became dominant and organized into Tropical Depression Twenty on September 29. It was located in quite favorable conditions, but its large size kept strengthening gradual. The depression became Tropical Storm Victor later that day. It was the second earliest formation of a twentieth named storm on record, behind only Vicky of the previous year, which formed on September 14. Victor was named at an unusually low latitude for the Atlantic at 8.3° N.
Despite forming close to the equator, the storm gained latitude steadily as its trajectory bent from west-northwest to northwest due to the influence of an upper-level low in the subtropics eating away at the ridge that usually steers such storms west. Meanwhile, Victor managed to consolidate a little and strengthen into a high-end tropical storm with maximum winds of 65 mph and a central pressure of 997 mb. However, on October 1 it moved into the sphere of influence of the aforementioned upper-level low, which began to impart strong wind shear. At the same time, Victor reached a drier airmass. The storm steadily weakened from there on out.
The storm became a tropical depression on October 2, but intermittent convective bursts allowed it to remain a tropical cyclone for a while after that. Wind shear degraded the circulation gradually and Victor at last degenerated into a trough of low pressure on October 4.
The above image shows Victor at peak intensity, when it was already dealing with increasing shear and dry air intrusion.
During most of September, the steering pattern over the tropical Atlantic allowed tropical cyclones to escape northward, out to sea. Victor followed this pattern, avoiding land areas.
On September 27, a tropical wave moved off of Africa into the eastern Atlantic. It was located on the eastern edge of a monsoonal trough of low pressure, while another tropical wave was situated on the western end. For a few days, these disturbances battled it out, but the eastern one ultimately became dominant and organized into Tropical Depression Twenty on September 29. It was located in quite favorable conditions, but its large size kept strengthening gradual. The depression became Tropical Storm Victor later that day. It was the second earliest formation of a twentieth named storm on record, behind only Vicky of the previous year, which formed on September 14. Victor was named at an unusually low latitude for the Atlantic at 8.3° N.
Despite forming close to the equator, the storm gained latitude steadily as its trajectory bent from west-northwest to northwest due to the influence of an upper-level low in the subtropics eating away at the ridge that usually steers such storms west. Meanwhile, Victor managed to consolidate a little and strengthen into a high-end tropical storm with maximum winds of 65 mph and a central pressure of 997 mb. However, on October 1 it moved into the sphere of influence of the aforementioned upper-level low, which began to impart strong wind shear. At the same time, Victor reached a drier airmass. The storm steadily weakened from there on out.
The storm became a tropical depression on October 2, but intermittent convective bursts allowed it to remain a tropical cyclone for a while after that. Wind shear degraded the circulation gradually and Victor at last degenerated into a trough of low pressure on October 4.
The above image shows Victor at peak intensity, when it was already dealing with increasing shear and dry air intrusion.
During most of September, the steering pattern over the tropical Atlantic allowed tropical cyclones to escape northward, out to sea. Victor followed this pattern, avoiding land areas.
Labels:
2021 Storms
Saturday, September 25, 2021
Subtropical Storm Teresa (2021)
Storm Active: September 24-25
On September 23, a surface trough formed in conjunction with an upper-level low that was producing a huge area of scattered thunderstorm activity in an arc east and south of Bermuda. The system consolidated some over the following day as it moved generally northward and a well-defined surface center appeared north of Bermuda. The island experienced only minor impacts as the disturbance passed near it. There was some deep convection too, though it was generally located north and east of the center of circulaton. The storm was non-frontal. However, it was still located under an upper-level low and furthermore did not look much like a conventional tropical storm: thus, it was classified Subtropical Storm Teresa. Teresa was the second earliest nineteenth named storm (typically, "T" storm) on record, after only Teddy of 2020.
The storm's genesis was not well-anticipated, and it only had a small window for intensification, as a powerful extratropical low was forming near New England. Teresa was heading northwest initially, and then turned north and then northeast as it became caught up in the low. Increasing shear overwhelmed the storm and it became post-tropical on September 25. The low lost its identity soon after.
Teresa's satellite presentation looks distinctly subtropical, with little convection near the center and an asymmetric appearance.
Teresa added to the list of short-lived cyclones of the 2021 season.
On September 23, a surface trough formed in conjunction with an upper-level low that was producing a huge area of scattered thunderstorm activity in an arc east and south of Bermuda. The system consolidated some over the following day as it moved generally northward and a well-defined surface center appeared north of Bermuda. The island experienced only minor impacts as the disturbance passed near it. There was some deep convection too, though it was generally located north and east of the center of circulaton. The storm was non-frontal. However, it was still located under an upper-level low and furthermore did not look much like a conventional tropical storm: thus, it was classified Subtropical Storm Teresa. Teresa was the second earliest nineteenth named storm (typically, "T" storm) on record, after only Teddy of 2020.
The storm's genesis was not well-anticipated, and it only had a small window for intensification, as a powerful extratropical low was forming near New England. Teresa was heading northwest initially, and then turned north and then northeast as it became caught up in the low. Increasing shear overwhelmed the storm and it became post-tropical on September 25. The low lost its identity soon after.
Teresa's satellite presentation looks distinctly subtropical, with little convection near the center and an asymmetric appearance.
Teresa added to the list of short-lived cyclones of the 2021 season.
Labels:
2021 Storms
Wednesday, September 22, 2021
Hurricane Sam (2021)
Storm Active: September 22-October 5
A tropical wave exited Africa into the Atlantic on September 19. Finding favorable conditions, it began to organize, and a spin was soon evident on satellite imagery. It stayed pretty far south, missed Cabo Verde, and moved west over the next few days. By the 21st, a low had formed, but the disturbance didn't have the closed circulation center necessary to be called a tropical cyclone. One more day was enough for the system to become Tropical Depression Eighteen.
It took another day or so for the new tropical cyclone to start intensifying, but after that it was off to the races. On September 23, it strengthened into Tropical Storm Sam, which was the second earliest an eighteenth named storm had ever formed on record in the Atlantic (Sally of 2020 was the record-holder). Sam had a small core, which allowed it to quickly vault to hurricane strength on the 24th. There was little wind shear in the system's vicinity, and waters were plenty warm to support development; the moderately dry mid-level air around the storm was unable to penetrate it and slow down the intensification process. By the afternoon of September 25, Sam reached category 4 intensity.
After having moved west for a few days, Sam had slowed down and turned west-northwest under the influence of a weak subtropical ridge. Indeed, the ridge was so weak that Sam's forward motion was unusually slow for a hurricane in its location. The storm was still small enough that cold water upwelling didn't present a significant issue even with the lower forward speed. The cyclone had a small, symmetric eye surrounded by extremely cold cloud tops and managed to reach a peak intensity of 155 mph winds and a central pressure of 929 mb during the afternoon of September 26. Right afterward, the eye contracted and dry air forced its way into the center from the east during an eyewall replacement, causing sudden rapid weakening. This brought Sam down to category 3 by the 27th.
As the storm continued northwest, it fought back, restrengthening to category 4 the next day. Its structure was quite different, with a larger, less symmetric eye, and a larger radius of maximum winds. On September 29, it made its closest approach to the Lesser Antilles, passing well to the northeast. The next day, Sam begin to speed up and turn north as it rounded the subtropical ridge. Remarkably, the storm continued intensifying, reaching its secondary peak intensity of 150 mph winds and a central pressure of 934 mb early on October 1.
Overnight, Sam made its closest approach to Bermuda to the south-southeast; the island was far enough away to be spared significant impacts. Gradual weakening commenced as the storm recurved, but its tropical storm force windfield continued to expand. Early on October 3, Sam finally lost major hurricane strength after being category 3 or above for 7.75 consecutive days, joining only a small handful of Atlantic hurricanes to achieve this feat. Later that day, as it moved northeast toward the north wall of the Gulf stream, the eye cleared out again and became symmetric, with well-defined concentric eyewalls. This resulted in some restrengthening that evening near 40° N! The storm's structure was exceptional for that latitude. At last, on October 4, Sam encountered much colder water and began extratropical transition. As the inner core decayed, Sam weakened to a category 1. The storm became a hurricane-force extratropical low early on October 5 and merged with another low over the far north Atlantic soon after.
The above image shows Sam at its peak intensity on September 26.
Sam's long track as a major hurricane made it one of the largest Accumulated Cyclone Energy (ACE) producers recorded. Despite its longevity, Sam didn't affect any landmasses except Bermuda, to which it only delivered a glancing blow.
A tropical wave exited Africa into the Atlantic on September 19. Finding favorable conditions, it began to organize, and a spin was soon evident on satellite imagery. It stayed pretty far south, missed Cabo Verde, and moved west over the next few days. By the 21st, a low had formed, but the disturbance didn't have the closed circulation center necessary to be called a tropical cyclone. One more day was enough for the system to become Tropical Depression Eighteen.
It took another day or so for the new tropical cyclone to start intensifying, but after that it was off to the races. On September 23, it strengthened into Tropical Storm Sam, which was the second earliest an eighteenth named storm had ever formed on record in the Atlantic (Sally of 2020 was the record-holder). Sam had a small core, which allowed it to quickly vault to hurricane strength on the 24th. There was little wind shear in the system's vicinity, and waters were plenty warm to support development; the moderately dry mid-level air around the storm was unable to penetrate it and slow down the intensification process. By the afternoon of September 25, Sam reached category 4 intensity.
After having moved west for a few days, Sam had slowed down and turned west-northwest under the influence of a weak subtropical ridge. Indeed, the ridge was so weak that Sam's forward motion was unusually slow for a hurricane in its location. The storm was still small enough that cold water upwelling didn't present a significant issue even with the lower forward speed. The cyclone had a small, symmetric eye surrounded by extremely cold cloud tops and managed to reach a peak intensity of 155 mph winds and a central pressure of 929 mb during the afternoon of September 26. Right afterward, the eye contracted and dry air forced its way into the center from the east during an eyewall replacement, causing sudden rapid weakening. This brought Sam down to category 3 by the 27th.
As the storm continued northwest, it fought back, restrengthening to category 4 the next day. Its structure was quite different, with a larger, less symmetric eye, and a larger radius of maximum winds. On September 29, it made its closest approach to the Lesser Antilles, passing well to the northeast. The next day, Sam begin to speed up and turn north as it rounded the subtropical ridge. Remarkably, the storm continued intensifying, reaching its secondary peak intensity of 150 mph winds and a central pressure of 934 mb early on October 1.
Overnight, Sam made its closest approach to Bermuda to the south-southeast; the island was far enough away to be spared significant impacts. Gradual weakening commenced as the storm recurved, but its tropical storm force windfield continued to expand. Early on October 3, Sam finally lost major hurricane strength after being category 3 or above for 7.75 consecutive days, joining only a small handful of Atlantic hurricanes to achieve this feat. Later that day, as it moved northeast toward the north wall of the Gulf stream, the eye cleared out again and became symmetric, with well-defined concentric eyewalls. This resulted in some restrengthening that evening near 40° N! The storm's structure was exceptional for that latitude. At last, on October 4, Sam encountered much colder water and began extratropical transition. As the inner core decayed, Sam weakened to a category 1. The storm became a hurricane-force extratropical low early on October 5 and merged with another low over the far north Atlantic soon after.
The above image shows Sam at its peak intensity on September 26.
Sam's long track as a major hurricane made it one of the largest Accumulated Cyclone Energy (ACE) producers recorded. Despite its longevity, Sam didn't affect any landmasses except Bermuda, to which it only delivered a glancing blow.
Labels:
2021 Storms
Monday, September 20, 2021
Tropical Storm Rose (2021)
Storm Active: September 19-23
The assembly line of tropical cyclones continued as another tropical wave began to organize in the east Atlantic around September 18. Before long, it was named Tropical Storm Rose southwest of Cabo Verde. Only 2005 and 2020 had an "R" storm (or seventeenth named storm) form earlier in the season than Rose did. At the time of its formation, the high pressure ridge usually located between Bermuda and the Azores had retreated quite far east, leaving Rose an opportunity to move north-northwest. The storm had a day or two in favorable atmospheric conditions and over fairly warm water, and it strengthened modestly.
Just north of the tropics, however, Rose found drier air, higher shear, and cooler water beginning September 21. These snuffed out the storm's thunderstorm activity, leaving it a naked swirl by the 22nd. Rose weakened to a tropical depression that day. Soon after, it degenerated into a remnant low.
The above image shows Rose over the open east Atlantic.
Due to a weakness in the subtropical ridge, Rose turned north just west of Cabo Verde and didn't spend much time at a tropical cyclone.
The assembly line of tropical cyclones continued as another tropical wave began to organize in the east Atlantic around September 18. Before long, it was named Tropical Storm Rose southwest of Cabo Verde. Only 2005 and 2020 had an "R" storm (or seventeenth named storm) form earlier in the season than Rose did. At the time of its formation, the high pressure ridge usually located between Bermuda and the Azores had retreated quite far east, leaving Rose an opportunity to move north-northwest. The storm had a day or two in favorable atmospheric conditions and over fairly warm water, and it strengthened modestly.
Just north of the tropics, however, Rose found drier air, higher shear, and cooler water beginning September 21. These snuffed out the storm's thunderstorm activity, leaving it a naked swirl by the 22nd. Rose weakened to a tropical depression that day. Soon after, it degenerated into a remnant low.
The above image shows Rose over the open east Atlantic.
Due to a weakness in the subtropical ridge, Rose turned north just west of Cabo Verde and didn't spend much time at a tropical cyclone.
Labels:
2021 Storms
Saturday, September 18, 2021
Tropical Storm Peter (2021)
Storm Active: September 18-22
A tropical wave entered the Atlantic in mid-September and encountered some favorable conditions for development; already by September 15, after about a day over water, there was a well-defined center of circulation. However, thunderstorm activity was limited over the next few days as it moved west-northwest. Convection increased some as the system moved nearer to the Lesser Antillies on the 17th, but it took until the 18th for a true closed surface low to appear. At that time, it was designated Tropical Depression Sixteen. Soon after that, it strengthened into Tropical Storm Peter.
Peter was approaching a major threat to its survival: a powerful upper-atmospheric trough was bringing high wind shear to much of the western Atlantic, and conditions became hostile for the new tropical storm as it continued west-northwestward. It managed to strengthen a little more the shear out of the west stripped the center of thunderstorm coverage on September 19. Flare-ups continued over the next day though, when the center passed just north of the Leeward Islands, too far away to cause much in the way of rain.
The system followed a typical curving path toward the north after that. Relentless shear brought about Peter's steady decline starting on September 20. The next day, it weakened to a tropical depression, and the following day, a remnant low. The remnants showed some signs of organization a few days later and were briefly monitored for redevelopment south of Bermuda. However, ex-Peter did not manage to regenerate into a tropical cyclone. Soon, it was absorbed by a larger low to the north.
The above image shows the sheared Tropical Storm Peter shortly after being named.
After crossing the tropical Atlantic as a tropical wave, Peter spent only a few days as a tropical cyclone because of hostile upper-level winds.
A tropical wave entered the Atlantic in mid-September and encountered some favorable conditions for development; already by September 15, after about a day over water, there was a well-defined center of circulation. However, thunderstorm activity was limited over the next few days as it moved west-northwest. Convection increased some as the system moved nearer to the Lesser Antillies on the 17th, but it took until the 18th for a true closed surface low to appear. At that time, it was designated Tropical Depression Sixteen. Soon after that, it strengthened into Tropical Storm Peter.
Peter was approaching a major threat to its survival: a powerful upper-atmospheric trough was bringing high wind shear to much of the western Atlantic, and conditions became hostile for the new tropical storm as it continued west-northwestward. It managed to strengthen a little more the shear out of the west stripped the center of thunderstorm coverage on September 19. Flare-ups continued over the next day though, when the center passed just north of the Leeward Islands, too far away to cause much in the way of rain.
The system followed a typical curving path toward the north after that. Relentless shear brought about Peter's steady decline starting on September 20. The next day, it weakened to a tropical depression, and the following day, a remnant low. The remnants showed some signs of organization a few days later and were briefly monitored for redevelopment south of Bermuda. However, ex-Peter did not manage to regenerate into a tropical cyclone. Soon, it was absorbed by a larger low to the north.
The above image shows the sheared Tropical Storm Peter shortly after being named.
After crossing the tropical Atlantic as a tropical wave, Peter spent only a few days as a tropical cyclone because of hostile upper-level winds.
Labels:
2021 Storms
Tropical Storm Odette (2021)
Storm Active: September 17-18
Around mid-September, there was an area of disturbed weather just northeast of the Bahamas associated with an upper-level trough. Gradually the vorticity worked down to surface level as the system moved generally north-northwestward over the following days. Shear was fairly high in the area, but the low managed to develop enough convection to be named Tropical Storm Odette off the U.S. mid-Atlantic coast on September 17.
Though it formed pretty close to land, it was already moving out to the northeast. Moreover, it was already beginning extratropical transition! The thunderstorm activity was well east of the center of circulation, and this "center" was in fact multiple low-level swirls orbiting one another. The poorly-organized cyclone degraded further as shear increased, but nevertheless strengthened due to interaction with an approaching front. Just a day after being named, Odette became post-tropical. The low moved out over the open north Atlantic and stalled southeast of Atlantic Canada for a few days. Though it was monitored for redevelopment, ex-Odette did not regenerate into a tropical cyclone. Within a few more days, it was swept away by the next trough entering the Atlantic.
The above image shows Odette shortly after formation. At least three vortices are visible, with the deep convection displaced east of the center.
Odette was only tropical for a day (see circular dots), but the post-tropical low spent several days meandering the north Atlantic after becoming post-tropical (triangular points).
Around mid-September, there was an area of disturbed weather just northeast of the Bahamas associated with an upper-level trough. Gradually the vorticity worked down to surface level as the system moved generally north-northwestward over the following days. Shear was fairly high in the area, but the low managed to develop enough convection to be named Tropical Storm Odette off the U.S. mid-Atlantic coast on September 17.
Though it formed pretty close to land, it was already moving out to the northeast. Moreover, it was already beginning extratropical transition! The thunderstorm activity was well east of the center of circulation, and this "center" was in fact multiple low-level swirls orbiting one another. The poorly-organized cyclone degraded further as shear increased, but nevertheless strengthened due to interaction with an approaching front. Just a day after being named, Odette became post-tropical. The low moved out over the open north Atlantic and stalled southeast of Atlantic Canada for a few days. Though it was monitored for redevelopment, ex-Odette did not regenerate into a tropical cyclone. Within a few more days, it was swept away by the next trough entering the Atlantic.
The above image shows Odette shortly after formation. At least three vortices are visible, with the deep convection displaced east of the center.
Odette was only tropical for a day (see circular dots), but the post-tropical low spent several days meandering the north Atlantic after becoming post-tropical (triangular points).
Labels:
2021 Storms
Sunday, September 12, 2021
Hurricane Nicholas (2021)
Storm Active: September 12-16
During early September, another tropical wave crossed the Atlantic, this one passing through the tropics without incident until it reached the southwestern Caribbean Sea. While the wave moved over central America on September 9, the northern portion pursued a more northwestward course toward the Bay of Campeche. There it merged with a trough, producing a large area of disturbed weather. Southwesterly wind shear made development slow, but the system managed to organize enough to be designated Tropical Storm Nicholas during the morning of September 12.
Nicholas initially moved northward, but turned a little toward the right on the 13th. Though that was the storm's general trajectory, the evolution of the interior was complex. The cyclone reformed to the north and east a few distinct times that day, and at points there were multiple vortices evident on radar, rotating one another cylonically. Despite the lack of a persistent center, Nicholas deepened significantly over the warm waters of the western Gulf of Mexico and reached hurricane strength very close to the coast of Texas that night (attaining a minimum pressure of 988 mb).
Just before landfall, Nicholas turned northeast and slowed down, postponing when it crossed the coastline into the early morning hours of September 14. At the time, it had its greatest peak winds of 75 mph. The storm quickly weakened inland as it moved east-northeast. Nevertheless, it was a prolific rain producer, with storm totals exceeding a foot of rain in parts of Texas and Louisiana. That night, it weakened to a tropical depression. Nicholas lingered near the Louisiana coast for several more days, decaying gradually, but still adding to its rain totals in the south. It became post-tropical on September 16, and finally dissipated on the 17th.
The above infrared satellite imagery shows Hurricane Nicholas just before landfall in Texas very early on September 14.
Nicholas's slow forward motion over the Gulf coast elevated rainfall amounts in Louisiana.
During early September, another tropical wave crossed the Atlantic, this one passing through the tropics without incident until it reached the southwestern Caribbean Sea. While the wave moved over central America on September 9, the northern portion pursued a more northwestward course toward the Bay of Campeche. There it merged with a trough, producing a large area of disturbed weather. Southwesterly wind shear made development slow, but the system managed to organize enough to be designated Tropical Storm Nicholas during the morning of September 12.
Nicholas initially moved northward, but turned a little toward the right on the 13th. Though that was the storm's general trajectory, the evolution of the interior was complex. The cyclone reformed to the north and east a few distinct times that day, and at points there were multiple vortices evident on radar, rotating one another cylonically. Despite the lack of a persistent center, Nicholas deepened significantly over the warm waters of the western Gulf of Mexico and reached hurricane strength very close to the coast of Texas that night (attaining a minimum pressure of 988 mb).
Just before landfall, Nicholas turned northeast and slowed down, postponing when it crossed the coastline into the early morning hours of September 14. At the time, it had its greatest peak winds of 75 mph. The storm quickly weakened inland as it moved east-northeast. Nevertheless, it was a prolific rain producer, with storm totals exceeding a foot of rain in parts of Texas and Louisiana. That night, it weakened to a tropical depression. Nicholas lingered near the Louisiana coast for several more days, decaying gradually, but still adding to its rain totals in the south. It became post-tropical on September 16, and finally dissipated on the 17th.
The above infrared satellite imagery shows Hurricane Nicholas just before landfall in Texas very early on September 14.
Nicholas's slow forward motion over the Gulf coast elevated rainfall amounts in Louisiana.
Labels:
2021 Storms
Subscribe to:
Posts (Atom)