Monday, July 1, 2024

Tropical Storm Chris (2024)

Storm Active: June 30-July 1

A tropical wave crossed the tropical Atlantic and reached the Caribbean on June 25. It remained quite far south, embedded in the Intertropical Convergence Zone, and so did not exhibit any signs of development until arriving in the western Caribbean a few days later. By June 28, the disturbance was creating a large area of scattered thunderstorms near the Yucatan Peninsula and the waters to the west, but lacked any discernible center of circulation. From there, the system's west-northwestward trajectory brought it across the peninsula, preventing further organization until it reached the Bay of Campeche. There, the system found a short window of opportunity to acquire a closed center and it was designated Tropical Depression Three on June 30.

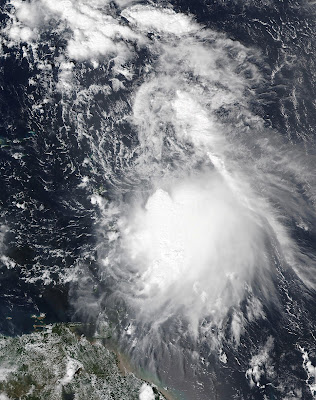
The storm's circulation was fairly broad and the associated convection diffuse, but aircraft reconaissance to the cyclone found evidence for gale force winds that evening, prompting an upgrade to Tropical Storm Chris. Very soon after the upgrade, Chris made landfall in Mexico in the state of Veracruz, south of where Tropical Storm Alberto had ten days earlier. The system rapidly weakened once inland, with the main threat being flooding rains. Chris dissipated by late morning on July 1.


The image above shows Tropical Depression Three on June 30, just before it was named. The center was already very close to the coastline of Mexico.


Chris had a very short lifetime as a tropical cyclone (circular points), but originated from a tropical wave that brought disturbed weather across the entire Caribbean.

Friday, June 28, 2024

Hurricane Beryl (2024)

Storm Active: June 28-July 9

On June 23, a tropical wave moved over the tropical Atlantic from the western coast of Africa. The wave encountered unusually warm water and moist air for June, which allowed it to gradually develop as it moved fairly quickly westward at 15-20 mph. By June 27, a broad low pressure center had formed and a nascent circulation was evident on satellite imagery. Convection increased near the center the next day and the system was designated Tropical Depression Two. This marked the easternmost June formation of an Atlantic tropical cyclone in over 20 years.

Later that evening, the depression was upgraded to Tropical Storm Beryl. From that point, Beryl underwent rapid intensification for the next few days, exhibiting the textbook evolution of a strengthening tropical cyclone. At first an amorphous blob of thunderstorms, Beryl developed pronounced spiral bands fanning out west of the circulation center early on the 29th. By that afternoon, a central dense overcast covered the center and the system began building an eyewall. Beryl was upgraded to a hurricane that evening. To that point, conditions near the storm were quick favorable to intensification with the exception of some wind shear from the east. However, since the shear vector pointed the same direction as the storm's motion, it had less of an effect than it otherwise would. Even the shear diminished by early on June 30, however. Beryl's burst of strengthening continued and it became the first major hurricane of the 2024 Atlantic hurricane season that morning as an eye emerged on satellite. At the time it reached category 3, it was located at 10.6° N, which was farther south than any major hurricane had ever been observed in the Atlantic, with the lone exception of Hurricane Ivan in 2004, which did the same at 10.2° N.

The eye cleared out further over the next few hours and Beryl reached category 4 strength, with peak winds of 130 mph. Beryl was the first Atlantic hurricane ever recorded to reach category 4 intensity in June; the previous earliest category 4 in a season was Hurricane Dennis of 2005, which reached that intensity on July 8. By that time, the storm was approaching the Windward islands, still moving at a fairly rapid clip just north of west. The eye contracted and clouded over during the night as the core of Beryl underwent an eyewall replacement cycle. This reduced the maximum winds back to category 3 intensity but broadened the windfield. A new larger eye cleared out during the morning of July 1 and the storm resumed intensification, regaining category 4 strength. That morning, Beryl made a direct landfall in the island of Carriacou, part of the Grenadine island chain in the Windward Islands, with maximum sustained winds of 150 mph and a minimum pressure of 950 mb. The cyclone was the first known major hurricane to directly hit any of the Grenadine Islands.

Beryl continued quickly toward the west-northwest and entered the Caribbean sea that afternoon. Ocean heat content was even higher in this region, and atmospheric conditions remained favorable, so the storm deepened even further as it left the Windward Islands behind. That night, it reached category 5. Beryl eclipsed Hurricane Emily of 2005 to become the earliest category 5 on record (Emily reached this category on July 16), and was only the second recorded category 5 in July. The hurricane reached its peak intensity of 165 mph winds and a pressure of 934 mb early in the morning on July 2. After that, wind shear began to increase, disrupting Beryl. Throughout the day, the circulation became somewhat tilted toward the northeast with height and the eye lost definition until it became cloud-filled; the satellite presentation also became much less symmetric. Despite all this, the system weakened only slowly: it was reduced to category 4 during the afternoon of July 2, but maintained category 4 intensity through July 3.

Beryl's center passed just south of Jamaica during the day, but close enough that the northern eyewall crossed the coastal areas of the southwestern portion of the island. The northern eyewall had the strongest winds, so the impacts were fairly severe despite the lack of an official landfall. This land interaction and still increasing shear brought the system down to category 3 intensity overnight, but the inner core was surprisingly resilient, with at least the northern eyewall remaining intact into July 4. That morning, the storm passed south of Grand Cayman of the Cayman Islands, still a major hurricane; the center was a little further away, so the island was not affected as much as Jamaica.

The storm diminished to a category 2 that afternoon, but unexpectedly halted its weakening trend and fluctuated in strength later that day. Its continued west-northwesterly motion brought it toward the Yucatan Peninsula overnight and Beryl made landfall near Tulum as a category 2 during the morning of July 5. Fortunately, the storm started weakening again immediately prior to landfall and the windfield contracted some, limiting impacts. The cyclone's passage over the Yucatan Peninsula finally damaged it more significantly: the vortex became tilted with height and all deep convection was gone from the center by the time it emerged into the Gulf of Mexico that evening. At that time, Beryl's winds had fallen to tropical storm force. The Gulf waters, particularly immediately northwest of Yucatan, did not have as much heat content as the Caribbean Beryl had just left; further, some dry air from the southwest had been entrained into the circulation. Therefore, even once over water it took time for the system to recuperate. Strong thunderstorm activity only began to return in earnest around 12 hours after it emerged over water, during the morning of July 6.

Beryl began to feel the influence of a trough of low pressure over the central United States and it curved toward the northwest that day. The storm's battle with dry air greatly slowed intensification, though some deepening began on July 7. That night, the system approached the Texas coastline, but found more favorable conditions in its last hours over water. Beryl regained hurricane intensity and made landfall in Texas early on July 8th with peak sustained winds of 80 mph and a minimum central pressure of 979 mb. Though the cyclone was only a category 1, the curvature of the Texas coastline amplified storm surge impacts, and the storm held its own a fair way inland, bringing hurricane force winds to the Houston area.

Beryl gradually weakened as it pushed farther inland on the 8th and curved toward the northeast. The cyclone diminished to a tropical storm late that morning and a tropical depression that evening. Beryl accelerated northeastward until it became post-tropical the morning of July 9 while centered over Arkansas. Its remnants continued to bringing heavy rains across the central United States over the next few days.


The image above shows Beryl at peak intensity during the morning of July 2 as a category 5 hurricane. Beryl's strength was unprecedented for any hurricane ever recorded so early in Atlantic hurricane season.


Beryl had severe impacts all along its path, including the Windward Islands, Jamaica, the Yucatan peninsula, and Texas.

Thursday, June 20, 2024

Tropical Storm Alberto (2024)

Storm Active: June 19-20

In mid-June, a large area of disturbed weather formed from the Central American Gyre (CAG), a seasonal area of low pressure and stormy weather which extends from the southwestern Caribbean to adjacent parts of the eastern Pacific. This gyre is most pronounced near the beginning and end of hurricane season. Once the disturbance separated from the main gyre and crossed the Yucatan peninsula, it encountered favorable conditions in the Bay of Campeche and began to slowly organize. Disturbances born from the CAG are typically very large and take time to consolidate, so even though the system was already producing gale force winds by June 17, it was not yet a tropical cyclone.

It continued northwest and then west for the next couple of days, and by June 19 had a tighter circulation and a spiral band of thunderstorms extending south and west of the center. Therefore, it was named Tropical Storm Alberto, the first named storm of the 2024 Atlantic hurricane season. Fortunately, Alberto did not have time to develop an inner core and intensify quickly, but it still strengthened a little. By the morning of June 20, it had reached its peak intensity of 50 mph winds and a central pressure of 993 mb. That same morning, it made landfall in Mexico, close to the northern border of the state of Veracruz. Because Alberto had a very large windfield, there were notable storm surge impacts well to the north of the landfall point, even in the southernmost Texas coastline. Once over land, the storm quickly weakened and the circulation dissipated by that afternoon.


The image above shows Alberto as a tropical storm in the early evening of June 19.


Alberto spent just over a day as a tropical cyclone, but still caused notable rainfall and storm surge impacts.

Tuesday, May 28, 2024

Professor Quibb's Picks – 2024

My personal prediction for the 2024 North Atlantic Hurricane season (written May 28, 2024) is as follows:

24 cyclones attaining tropical depression status,
22 cyclones attaining tropical storm status,
12 cyclones attaining hurricane status, and
6 cyclones attaining major hurricane status.

This prediction far exceeds the 1991-2020 averages of 14.4 tropical storms, 7.2 hurricanes, and 3.2 major hurricanes each season. In short, I expect 2024 to be very active, with a moderate probability of breaking the top 5 most active seasons ever recorded, at least in terms of number of named storms. Below, I'll discuss the various factors that went into making this prediction.

The biggest story of the year so far in hurricane forecasting is the unprecedented warming of the tropical Atlantic ocean. For many decades, climate scientists have documented the increasing ocean temperatures caused by anthropogenic global warming, but 2024 stands out in particular.


The chart above shows the global averaged sea surface temperature since 1981. The second half of 2023 and 2024 thus far have seen average ocean temperatures far above what had been previously observed. On its own, a global ocean temperature increase should correlate to more fuel for tropical cyclone formation, but this isn't all.


The above diagram gives a snapshot from earlier this month of global sea surface temperature anomalies relative to the current mean. This means that the the large positive average anomaly from the previous image is accounted for, and we're looking at deviations from that average. One area that stands out is the tropical Atlantic, which is experiencing unusual warmth on top of an unprecedented global mean. In previous years, I've often commented on warm ocean temperatures and their contribution to more active seasons, but this year's signal is stronger than any I've seen. This factor alone is enough to predict a very active hurricane season.

One other area that stands out in the previous global ocean temperature map is the equitorial eastern Pacific, which is relatively much cooler. This signals the return of La Niña conditions, which have ramifications for global weather.


The chart above is the model forecast of the El Niño Southern Oscillation (ENSO) index, a composite measure of the sea surface temperature anomalies in the equitorial Pacific. Most of 2023 saw a positive index, called El Niño, but the index has recently been dropping, and the official conditions for a La Niña event should be met by peak hurricane season. Typically such an event is correlated with lower wind shear and hence less disruption to developing cyclones. Therefore, this is another signal in favor of an active hurricane season.


I'll run through a few more quick factors. Early indications point to a west African monsoon which is more robust than usual (this is captured, for instance, by the long-term model precipitation forecast above for the three month period August-October 2024). Many hurricanes have their origin in disturbances crossing west Africa, so this could mean that there are more "seeds" for hurricane formation; this is yet another positive factor for an active 2024. Lastly, I often consider the strength of trade winds and the magnitude of zonal wind shear across the Atlantic basin. Roughly, this is a measure of how consistent the direction and strength of the east-west component of wind is at different altitudes in the atmosphere. As mentioned above, La Niña usually leads to lower wind shear, but it's worth noting that these measures have remained close to average for 2024 thus far. This factor therefore doesn't have a significant forecast impact right now.

Next, I'll give a finer analysis of the risks by region. My estimates are on a scale from 1 (least risk) to 5 (most risk).

U.S. East Coast and Atlantic Canada: 5
The east coast of North America is at extreme risk from hurricanes this year. Ocean warmth was already discussed above, but on top of that, the likelihood of La Niña conditions and current model data both point to stronger than usual ridging over the subtropical Atlantic this summer. This means that tropical cyclone tracks have less chance of curving out to sea and an increased risk to land.

Yucatan Peninsula and Central America: 4
The same factors pointing to an active hurricane season suggest an above-normal risk for these regions. However, the predicted shear and atmospheric moisture anomalies aren't quite as favorable in the southern and western Caribbean, so I'll assign a "4" rather than a "5" here.

Carribean Islands: 5
For the last few years, many tropical cyclones forming in the tropical Atlantic had some struggles with dry air and wind shear as they approached the Caribbean; others curved out to sea before impacting the islands. This year, the risk seems much higher: a more robust African monsoon will lead to more long-track hurricanes and ample atmospheric moisture. Further, the developing La Niña will suppress shear and keep storms on a more westward track.

Gulf of Mexico: 4
As with every other region, the coast of the Gulf of Mexico is at high risk. The choice of "4" rather than "5" is due to some expected dryness, especially in the western Gulf where extreme heat and drought may prevail for significant parts of the season. The eastern Gulf should be on high alert, especially near the peak of the season in August and September.

Overall, I expect the 2024 Atlantic hurricane season to be very active, potentially historically so. Nevertheless, this is just an amateur forecast. Individuals in hurricane-prone areas should always have emergency measures in place. For more on hurricane safety sources, see here. Remember, devastating storms can occur even in otherwise quiet seasons.

Sources: https://www.cpc.ncep.noaa.gov/products/analysis_monitoring/lanina/enso_evolution-status-fcsts-web.pdf, https://tropical.colostate.edu/Forecast/2024-04.pdf, https://www.tropicaltidbits.com/analysis/models/, https://www.noaa.gov/news-release/noaa-predicts-above-normal-2024-atlantic-hurricane-season

Monday, May 6, 2024

Hurricane Names List – 2024

The name list for tropical cyclones forming in the North Atlantic basin for the year 2024 is as follows:

Alberto
Beryl
Chris
Debby
Ernesto
Francine
Gordon
Helene
Isaac
Joyce
Kirk
Leslie
Milton
Nadine
Oscar
Patty
Rafael
Sara
Tony
Valerie
William

This list is the same as that for the 2018 season, with the exception of Francine and Milton, which replaced the retired names Florence and Michael, respectively.

Friday, December 15, 2023

2023 Season Summary

The 2023 Atlantic hurricane season was above average in activity, with a total of

21 cyclones attaining tropical depression status,
20 cyclones attaining tropical storm status,
7 cyclones attaining hurricane status, and
3 cyclones attaining major hurricane status.

Before the beginning of the season, I predicted that there would be

15 cyclones attaining tropical depression status,
14 cyclones attaining tropical storm status,
8 cyclones attaining hurricane status, and
4 cyclones attaining major hurricane status.

The average numbers of tropical storms, hurricanes and major hurricanes (over the 30 year period 1991-2020) were 14.4, 7.2, and 3.2, respectively. The eventual numbers for 2023 were well above my prediction for the total number of named storms, though my forecasts for hurricanes and major hurricanes were actually slight overestimates. The (preliminary) Accumulated Cyclone Energy value for the 2023 season is 146, solidly above average. This measure of activity accounts both for strength and duration of tropical cyclones. The exact value sometimes shifts when post-season analysis is complete. Overall, the 2023 season was a mixed bag, well above average in some indicators and near to slightly below in some others. This reflected the unusual conditions that made predicting 2023's outcome particularly tricky.


The 2023 season took place during a fairly strong El Niño event, meaning that equatorial Pacific sea surface temperatures were well above recent normals (the anomalies in different regions are shown in the diagram above). There's a well-established correlation between these anomalies and weather trends throughout the rest of the world, including stronger shear over the Atlantic ocean and a weaker Bermuda high. These tend to led to suppressed hurricane activity and more storms curving out to sea, respectively.


Though several cyclones this season struggled with wind shear, the overall wind shear pattern was not the typical one for an El Niño (see the figure above). Indeed, most of the main development region of the Atlantic basin had below-normal zonal wind shear, where zonal means the component of wind shear in the longitudinal direction. The following diagram illustrates just how unusual this combination of low wind shear and El Niño is, relative to the historical record.


The primary reason that El Niño did not behave normally was the incredibly warm sea surface temperatures in the tropical Atlantic. These warm waters were the result of a combination of anthropogenic global warming and a spring of very weak trade winds, which left the surface portion of the ocean unmixed with cooler waters below. This helps to explain the large number of named storms that formed in 2023. Fortunately for many land areas, however, the other common effect of El Niño did manifest: the Atlantic subtropical ridge was extremely weak all season, allowing many storms to recurve out to sea without affecting land. This included the season's strongest storm, category 5 Hurricane Lee. In fact, 2023 had the lowest death toll and damages from tropical cyclones dating back at least to the 2015 season.

2023's activity also came in intense bursts. The month of June was quite active with three named storms, including two tropical storm formations (Bret and Cindy) in the tropical Atlantic, which is the first such occurrence on record. After that, only one storm formed between June 26 and August 19! The floodgates opened after that, however, with the period from August 20 and September 28 seeing the formation of a whopping 13 named storms (a new record, beating 2020), and 5 hurricanes (tying a record last set in 2012). November, the last month of hurricane season, saw no formations at all.

In my region-by-region predictions, I forecasted that the Caribbean islands would be at high risk this season, and that the coast of the Gulf of Mexico and U.S. east coast would be at relatively low risk. These predictions were reasonably accurate, since the majority of tropical cyclones which affected land this year did so in the Lesser Antilles. Of course, Hurricane Idalia's category 3 landfall in the big bend region of Florida was the one major exception. Idalia caused significant impacts, but they were smaller in magnitude compared to other major hurricane impacts in the region in previous years due to the landfall location and the relatively small radius of maximum winds. Some other notable facts or records from 2023 include:
  • Though it wasn't operationally identified at the time, a unnamed subtropical cyclone formed in the northwestern Atlantic on January 16, and became the strongest tropical or subtropical Atlantic cyclone ever recorded in January
  • Hurricane Franklin's minimum pressure of 926 mb was the lowest ever recorded in a tropical cyclone that far north in the open Atlantic
  • Tropical Storm Philippe claimed the unusual record of longest-lasting Atlantic tropical cyclone with a peak intensity of under 70 mph


The 2023 season was unpredictable from start to finish, but ultimately had relatively mild impacts compared to many other recent years.

Sources: https://www.cpc.ncep.noaa.gov/products/analysis_monitoring/lanina/enso_evolution-status-fcsts-web.pdf, https://yaleclimateconnections.org/2023/11/the-unusual-2023-atlantic-hurricane-season-ends/, https://tropical.colostate.edu/Forecast/2023-11.pdf

Monday, October 23, 2023

Tropical Depression Twenty-One (2023)

Storm Active: October 23-24

Around October 20, a broad area of low pressure in the far southwestern Caribbean sea began to organize. It drifted very slowly westward and became more concentrated, all the while bringing heavy rains to the neighboring central American countries. During the afternoon of October 23, it was designated Tropical Depression Twenty-One. There was no time for the system to develop any more, however, because it made landfall that very night in central Nicaragua. The main impact was heavy rainfall. Twenty-One dissipated by the next morning.


The image above shows Twenty-One shortly after formation.


Twenty-One only became a tropical cyclone less than 12 hours before landfall in Nicaragua.

Thursday, October 19, 2023

Hurricane Tammy (2023)

Storm Active: October 18-26,27-29

Around October 10, yet another late season tropical wave entered the eastern tropical Atlantic. The system gained organization as it moved westward and appeared to be close to tropical depression status on October 14. However, no well-defined center formed, and conditions became a little less favorable over the next few days. Thunderstorm activity in association with the broad low became more diffuse, and it took even more time for it to regroup. It wasn't until October 18 that the system finally was upgraded to Tropical Storm Tammy. At that time, it was 1000 kilometers east of the Windward Islands.

Tammy developed a fairly impressive central dense overcast and had good inflow on satellite imagery, but the vortex also showed clear tilt and was elongated northwest to southeast. This limited significant strengthening in the short term, but aircraft reconnaissace did find that Tammy was producing sustained winds of around 60 mph on October 19, making it a fairly strong tropical storm. The next day, the cyclone reorganized somewhat and developed a very small core. This led to a short burst of intensification and Tammy was a category 1 hurricane late that morning. The storm gradually turned toward the northwest as it approached the Lesser Antilles. Its center passed just to the east of Martinique and Dominica on the morning of October 21. Though scattered heavy rainfall was widespread across the nearby islands, the small windfield of Tammy kept hurricane-force winds off of land for the most part.

After a bit more strengthening, Tammy reached its first peak intensity of 85 mph winds and a pressure of 988 mb later on the 21st. The center made a direct landfall in Barbuda that evening, bringing severe impacts to the small island. After that, the storm moved gradually away from the Caribbean islands, though rainfall lingered from the outer bands through October 22. The storm continued to round the periphery of the subtropical ridge and turned north. It maintained category 1 strength and continued to exhibit a small but powerful area of central convection.

In the subtropics, Tammy turned northeast and encountered a more diffluent upper-level environment. This began another period of strengthening late on October 24 and an eye appeared on satellite imagery the next morning. Tammy soon reached its peak intensity as a category 2 hurricane with 105 mph winds and a minimum pressure of 965 mb. Later in the day, stronger shear set in as the storm began to interact with a nearby front and weakening began. The storm underwent a rather quick extratropical transition early on October 26. Little more than a day later, though, ex-Tammy separated from the front and became a tropical cyclone again. At that point, it was estimated to be a strong tropical storm in intensity.

The storm remained very compact, with deep convection occurring only very close to the center. Therefore, even though it was rather close to Bermuda, the island did not receive any severe impacts. It moved south of east away from Bermuda after that and gradually weakened due to dry air around it. Warm ocean waters could not counteract the unfavorable atmospheric environment and Tammy lost deep convection by late on October 28. It became post-tropical for the final time early on the 29th.


The image above shows Hurricane Tammy at peak intensity as a category 2 on October 25.


Tammy's primary impacts were to the Leeward Islands.

Friday, October 13, 2023

Tropical Storm Sean (2023)

Storm Active: October 10-15

On October 6, a late-season tropical wave entered the Atlantic. By October, the Intertropical Convergence Zone retreats southward toward the equator, so tropical waves tend to form at lower latitudes. This system was no exception; it tracked westward over the next couple of days at around 7.5° N, passing well to the south of Cabo Verde. Though the wave was producing widespread thunderstorms, it took time to spin up. Late on October 10, it had acquired enough organization to be designated Tropical Depression Nineteen. The next morning, it was upgraded to Tropical Storm Sean.

A gap in the ridge to Sean's northwest allowed it to turn right and gain some latitude over the next few days. Due to wind shear, the storm remained disorganized. It even weakened to a tropical depression late on October 11 before regaining tropical storm status the next morning when a larger area of convection developed on the east side of the circulation.

Shear over the system relaxed somewhat after that, but Sean faced the new obstacle of very dry air aloft. This proved to be a more potent adversary for the cyclone; it weakened and grew increasingly shallow on the 14th, returning to tropical depression status. Intermittent convective bursts allowed the storm to retain its status as a tropical cyclone into the 15th, but they became steadily less organized. The decaying storm also turned back toward the west in the low-level flow. Late that day, the system became a remnant low. Not long after, the remnants dissipated east of the Leeward Islands.


The image above shows Sean as a disorganized tropical storm on October 13.


Sean did not affect any land areas.

Saturday, September 30, 2023

Tropical Storm Rina (2023)

Storm Active: September 28-October 1

On September 23, a fairly late season tropical wave entered the Atlantic. It moved westward at a low latitude, passing well south of Cabo Verde and crossing the tropical Atlantic at a steady pace. By the 26th, an area of low pressure had developed along the wave, but the last push to tropical storm status was slow-going due to the size of the disturbance and the fact that Tropical Storm Philippe was close by to the northwest. Around the same time, the system turned rather sharply toward the north-northwest as it began a binary interaction with Philippe. A closed circulation became evident on September 28 and the disturbance was named Tropical Storm Rina.

The storm was over warm water but faced strong westerly wind shear and some disruption from the interaction with Philippe, which was only a little over 500 miles away to the west. Therefore, convection was confined primarily to the south and east of Rina's center. Due to the Fujiwhara effect, Philippe and Rina began to orbit each other cyclonically, which meant that Rina picked up speed and turned toward the west-northwest over the next couple of days. On September 30, the storm turned poleward and separated from the binary interaction, weakening as it did so. The strong shear over Rina did not lessen, and the center lost definition on October 1. By late that evening, it had degenerated into a remnant low. What was left of Rina dissipated soon after.


The image above shows Tropical Storm Rina early on September 29. The eastern part of Tropical Storm Philippe is visible at left.


Rina was a short-lived tropical storm that did not affect land.