The idea of the electromagnetic field is essential to physics. Dating back to the work of James Clark Maxwell in the mid-1800s, the classical theory of electromagnetism posits the existence of certain electric and magnetic fields that permeate space. Mathematically, these fields assign vectors (arrows) to every point in space, and their values at various points determine how a charged particle moving in space would behave. For example, the magnetic field generated by a magnet exerts forces on other nearby magnetic objects. Crucially, the theory also explains light as an electromagnetic phenomenon: what we observe as visible light, radio waves, X-rays, etc. are "waves" in the electromagnetic field that propagate in space.
Maxwell's theory is still an essential backbone of physics today. Nevertheless, the introduction of quantum mechanics in the early 20th century introduced new aspects of electromagnetism. Perhaps most importantly, it was discovered that light comes in discrete units called photons and behaves in some ways both as a wave and a particle. Though electromagnetism on the human scale still behaves largely as the classical theory predicts, at small scales there are quantum effects to account for. Around the middle of the century, physicists Richard Feynman, Shinichiro Tomonaga, Julian Schwinger, and many others devised a new theory of quantum electrodynamics (or QED) that described how light and matter interact, even on quantum scales.
Naturally, QED predicted new phenomena that classical electromagnetism had not. One especially profound change was the idea of vacuum energy. For most purposes, "vacuum" is synonymous with "empty space". As is typical of quantum mechanics, however, a system is rarely considered to be in a single state, but rather in a superposition of many different states simultaneously. These different states can have different "weights" so that the system is "more" in one given state than another. This paradigm applies even to the vacuum. Certain pairs of particles may appear and disappear spontaneously in many of these states and even exchange photons. Some of the possible interactions are illustrated below with Feynman Diagrams.
In these diagrams, the loops represent the evanescent virtual particle pairs described above. Wavy lines represent the exchange of photons. Each of the six diagrams represents a possible vacuum interaction, and there are many more besides (infinitely many, in fact!). The takeaway is that the QED vacuum is not empty, but rather a "soup" of virtual particle interactions due to quantum fluctuations. Further, these interactions have energy, known as vacuum energy. This, at least, is the mathematical description. There are some curious aspects to this description, because the vacuum energy calculation in any finite volume yields a divergent series. In other words, there is theoretically an infinite amount of vacuum energy in any finite volume! Because of this, physicists devised a process called renormalization that cancels out these infinities in calculations describing the interaction of real particles. This process in fact gives results that have been confirmed by experiment. Nevertheless, it does not follow that the infinite vacuum energy exists in any "real" sense or is accessible to measurement. One possible way in which it is, however, is the Casimir Effect.
The setup of the Casimir effect involves two conducting metal plates placed parallel to one another. The fact that the plates are conducting is important because the electric field vanishes inside conducting materials. Now, the vacuum energy between the plates can be calculated as a sum over the possible wavelengths of the fluctuations of the electromagnetic field. However, unlike the free space vacuum, the possible wavelengths are limited by the size of the available space: the longest wavelength contributions to the vacuum energy do not occur between the plates (this is schematically illustrated in the image above). A careful subtraction of the vacuum energy density inside the plates from outside yields that there is more energy outside. Remarkably, this causes an attractive force between these plates known as the Casimir force. The force increases as the distance between plates is decreased. Precisely, the magnitude of the force F is proportional to 1/d4, where d is the distance between the plates. As a result, if the distance is halved, the force goes up by a factor of sixteen! The initial calculation of this effect was due to H.G.B Casimir in 1948.
Around 50 years after first being postulated, the effect was finally measured experimentally with significant precision. The primary issue was that for the Casimir force to be large enough to measure, the metal plates would have to be put very close to one another, less than 1 micrometer (0.001 mm). Even then, very sensitive instruments are necessary to measure the force. One landmark experiment took place in 1998. Due to the practical difficulty of maintaining two parallel plates very close to one another, this experiment utilized one metal plate and one metal sphere with a radius large compared to the separation (so that it would "look" like a flat plate close up). The authors of the experiment also added corrections to Casimir's original equation accounting for the sphere instead of the plane and the roughness of the metal surfaces (at the small distances of the experiment, microscopic bumps matter). They obtained the following data for the force as it varies with distance:
In the figure above, the squares indicate data points from the experiment and the curve is the theoretical model (including the corrections mentioned). The distance on the x-axis is in nanometers and the smallest distance measured was around 100 nm, hundreds of times smaller than the width of a human hair. Even at these minuscule distances, the force only reached a magnitude of about 1*10-10 Newtons, a billion times smaller than the weight of a piece of paper. Nevertheless, the results confirmed the presence of the Casimir force to high accuracy.
The existence of the Casimir effect would seem to vindicate the rather strange predictions of QED with respect to the quantum vacuum, suggesting that it is indeed full of energy that can be tapped, if indirectly. However, others have argued that it is possible to derive the effect without reference to the energy of the vacuum, and therefore the experiment does not necessarily mean that vacuum energy is "real" in any meaningful way. Continued study into the existence of vacuum energy may help to explain the accelerating expansion of the universe since some mysterious "dark energy" is believed to be the source. In the mean time, the Casimir effect is an important experimental verification of QED and could someday see applications in nanotechnology, since the force would be relatively large on small scales.
Sources: https://www.scientificamerican.com/article/what-is-the-casimir-effec/, https://arxiv.org/pdf/hep-th/0503158.pdf, The Quantum Vacuum: An Introduction to Quantum Electrodynamics by Peter W. Milonni, http://web.mit.edu/kardar/www/research/seminars/PolymerForce/articles/PRL-Mohideen98.pdf
Showing posts with label Forces. Show all posts
Tuesday, March 5, 2019
Saturday, February 20, 2016
The Detection of Gravitational Waves
For an introduction to gravitational waves, see here.
Before 2016, a nobel prize had already been rewarded for an observation that was consistent with, and seemed to confirm, the existence of gravitational waves. In 1974, Russell Hulse and Joesph Taylor discovered a very compact binary system of objects at a distance of 21,000 light years, consisting of two neutron stars orbiting one another. One of the bodies was also a pulsar, meaning that the radiation beams emitted from its poles periodically point toward Earth as it rotates. Since the rotation rate of a neutron star changes only very slowly over time, pulsars are fairly precise clocks. However, Hulse and Taylor detected that the pulses did not reach Earth precisely on time, but varied slightly from the expected arrival time. They were sometimes sooner, sometimes later in a regular pattern, indicating that the pulsar in question was in fact part of a binary system.
The above diagram depicts the binary system consisting of pulsar B1913+16 and its companion, another neutron star. No radiation from the companion has been observed on Earth, indicating that its poles oriented away from us. However, its presence can be inferred from the fact that the pulsar moves farther and closer to Earth in a short, regular period, indicating an orbit. The difference in arrival times is about 3 seconds, indicating that the orbit is about 3 light-seconds across. Further, the orbital period is 7.75 hours.
This discovery provided an excellent opportunity to confirm the predictions of general relativity: such a compact system with rapidly orbiting masses would radiate fairly large quantities of gravitational radiation. However, direct detection was well beyond 1970's technology. Instead, Taylor observed the pulsar system over a number of decades, and found the following:
Since the discovery of the pulsar, its orbital period had been decreasing very slowly, though steadily and measurably, by about 35 seconds over a timespan of 30 years. This is very little relative to the total period of 7.75 hours, but the data matched the predictions of general relativity almost precisely: as energy was lost to gravitational waves, the neutron stars gradually spiral inward toward one other as their orbits becoming shorter and shorter. This remarkable confirmation of a prediction of relativity won Hulse and Taylor the Noble Prize in physics in 1993.
And there the matter sat. Though detectors grew more and more advanced, no direct detections of gravitational waves were made for over 20 years. This all changed in 2015.
On September 14, 2015, at 09:50:45 UTC, shortly after LIGO (the Laser Interferometer Gravitational-Wave Observatory) resumed activity following an upgrade, the two detectors in Washington State and Louisiana picked up a transient gravitational wave signal, the first ever observed by humankind. The announcement of the discovery was made several months later, on February 11, 2016.
The above image shows the signals recorded at Hanford, Washington (left) and Livingston, Louisiana (right). The signals are also superimposed on the right to demonstrate their similarity. The horizontal axis is time, measured relative to 09:50:45 UTC on that day. The reader may notice that the event was distinguishable from the surrounding noise in the detector for only about 0.05 seconds (the third row charts the residual noise after the theoretical waveform in the second row is subtracted out). The final row shows the rapid increase in gravitational wave amplitude during the event and the subsequent silence. The vertical dimension in the first several rows is the relative strain on the detectors, or the amount by which the different arms of LIGO were stretched or compressed by the ripples in spacetime. The scale for these axes measures strain by parts in 10-21. This corresponds to extraordinarily minute changes in length: the 4 kilometer arms of the LIGO detector changed by only about 10-18 meters, only about one thousandth the diameter of a proton!
The theoretical wave form above was a simulation of the event that generated the gravitational waves: the final in-spiraling and ultimate merging of two black holes. The increasing frequency and amplitude of the signals corresponds to the final moments of the collapsing system as the two black holes orbit faster and faster and tighter and tighter around one another before finally combining. Further, the signals at the two detectors were separated by 6.9 ms, smaller than the light travel time between the sites of 10 ms. The delay between the arrival times allows the direction of the source to be identified.
This image shows the region in the sky from which the signals likely originated. The colors indicate the confidence that the source lay within the indicated region: purple is the 90% confidence region and yellow the 50% confidence region. The uncertainty arises from the fact that there were two detectors, and not the three required for a full triangulation.
In addition to the location of the source, the analysis of the waveform yields more. The distance of the system was roughly 1.2 billion light-years, meaning that the merger that we are just now observing occurred over a billion years ago. The two black holes had respective masses of about 36 and 29 solar masses, while the final black hole after the merger weighed in at 62 solar masses. This corresponds to a loss of about 3 solar masses, which was all converted into energy released as gravitational waves as the holes merged. The magnitude of this cataclysm can scarcely be overstated: at its peak, the rate of energy release was an estimated 3.6x1049 W, greater than the radiation emitted from all stars in the observable universe combined!
In addition to being a resounding confirmation of general relativity, the observation was the first truly direct detection of black holes: the fact that such massive objects came within hundreds of kilometers of one another indicates that they had extremely high densities, densities only possible in black holes. But while significant, cosmologists were already nearly certain that both gravitational waves and black holes existed. However, this discovery marks the opening of a brand new field of astronomy. Gravitational waves, which pass unimpeded through nearly anything over nearly any distance, allow us to "hear" cosmic events that we could not have detected before. In theory, these waves could allow us to observe the earliest stages of the universe, before it became transparent to electromagnetic radiation. In 2016, 100 years after Einstein predicted gravitational waves, we took the first step towards seeing the universe in a new way.
Sources: http://articles.adsabs.harvard.edu/cgi-bin/nph-iarticle_query?1989ApJ...345..434T&data_type=PDF_HIGH&whole_paper=YES&type=PRINTER&filetype=.pdf, https://journals.aps.org/prl/pdf/10.1103/PhysRevLett.116.061102, http://resources.edb.gov.hk/physics/articlePic/InterestingTopics/BinaryStars_pic04E.gif
Before 2016, a nobel prize had already been rewarded for an observation that was consistent with, and seemed to confirm, the existence of gravitational waves. In 1974, Russell Hulse and Joesph Taylor discovered a very compact binary system of objects at a distance of 21,000 light years, consisting of two neutron stars orbiting one another. One of the bodies was also a pulsar, meaning that the radiation beams emitted from its poles periodically point toward Earth as it rotates. Since the rotation rate of a neutron star changes only very slowly over time, pulsars are fairly precise clocks. However, Hulse and Taylor detected that the pulses did not reach Earth precisely on time, but varied slightly from the expected arrival time. They were sometimes sooner, sometimes later in a regular pattern, indicating that the pulsar in question was in fact part of a binary system.
The above diagram depicts the binary system consisting of pulsar B1913+16 and its companion, another neutron star. No radiation from the companion has been observed on Earth, indicating that its poles oriented away from us. However, its presence can be inferred from the fact that the pulsar moves farther and closer to Earth in a short, regular period, indicating an orbit. The difference in arrival times is about 3 seconds, indicating that the orbit is about 3 light-seconds across. Further, the orbital period is 7.75 hours.
This discovery provided an excellent opportunity to confirm the predictions of general relativity: such a compact system with rapidly orbiting masses would radiate fairly large quantities of gravitational radiation. However, direct detection was well beyond 1970's technology. Instead, Taylor observed the pulsar system over a number of decades, and found the following:
Since the discovery of the pulsar, its orbital period had been decreasing very slowly, though steadily and measurably, by about 35 seconds over a timespan of 30 years. This is very little relative to the total period of 7.75 hours, but the data matched the predictions of general relativity almost precisely: as energy was lost to gravitational waves, the neutron stars gradually spiral inward toward one other as their orbits becoming shorter and shorter. This remarkable confirmation of a prediction of relativity won Hulse and Taylor the Noble Prize in physics in 1993.
And there the matter sat. Though detectors grew more and more advanced, no direct detections of gravitational waves were made for over 20 years. This all changed in 2015.
On September 14, 2015, at 09:50:45 UTC, shortly after LIGO (the Laser Interferometer Gravitational-Wave Observatory) resumed activity following an upgrade, the two detectors in Washington State and Louisiana picked up a transient gravitational wave signal, the first ever observed by humankind. The announcement of the discovery was made several months later, on February 11, 2016.
The above image shows the signals recorded at Hanford, Washington (left) and Livingston, Louisiana (right). The signals are also superimposed on the right to demonstrate their similarity. The horizontal axis is time, measured relative to 09:50:45 UTC on that day. The reader may notice that the event was distinguishable from the surrounding noise in the detector for only about 0.05 seconds (the third row charts the residual noise after the theoretical waveform in the second row is subtracted out). The final row shows the rapid increase in gravitational wave amplitude during the event and the subsequent silence. The vertical dimension in the first several rows is the relative strain on the detectors, or the amount by which the different arms of LIGO were stretched or compressed by the ripples in spacetime. The scale for these axes measures strain by parts in 10-21. This corresponds to extraordinarily minute changes in length: the 4 kilometer arms of the LIGO detector changed by only about 10-18 meters, only about one thousandth the diameter of a proton!
The theoretical wave form above was a simulation of the event that generated the gravitational waves: the final in-spiraling and ultimate merging of two black holes. The increasing frequency and amplitude of the signals corresponds to the final moments of the collapsing system as the two black holes orbit faster and faster and tighter and tighter around one another before finally combining. Further, the signals at the two detectors were separated by 6.9 ms, smaller than the light travel time between the sites of 10 ms. The delay between the arrival times allows the direction of the source to be identified.
This image shows the region in the sky from which the signals likely originated. The colors indicate the confidence that the source lay within the indicated region: purple is the 90% confidence region and yellow the 50% confidence region. The uncertainty arises from the fact that there were two detectors, and not the three required for a full triangulation.
In addition to the location of the source, the analysis of the waveform yields more. The distance of the system was roughly 1.2 billion light-years, meaning that the merger that we are just now observing occurred over a billion years ago. The two black holes had respective masses of about 36 and 29 solar masses, while the final black hole after the merger weighed in at 62 solar masses. This corresponds to a loss of about 3 solar masses, which was all converted into energy released as gravitational waves as the holes merged. The magnitude of this cataclysm can scarcely be overstated: at its peak, the rate of energy release was an estimated 3.6x1049 W, greater than the radiation emitted from all stars in the observable universe combined!
In addition to being a resounding confirmation of general relativity, the observation was the first truly direct detection of black holes: the fact that such massive objects came within hundreds of kilometers of one another indicates that they had extremely high densities, densities only possible in black holes. But while significant, cosmologists were already nearly certain that both gravitational waves and black holes existed. However, this discovery marks the opening of a brand new field of astronomy. Gravitational waves, which pass unimpeded through nearly anything over nearly any distance, allow us to "hear" cosmic events that we could not have detected before. In theory, these waves could allow us to observe the earliest stages of the universe, before it became transparent to electromagnetic radiation. In 2016, 100 years after Einstein predicted gravitational waves, we took the first step towards seeing the universe in a new way.
Sources: http://articles.adsabs.harvard.edu/cgi-bin/nph-iarticle_query?1989ApJ...345..434T&data_type=PDF_HIGH&whole_paper=YES&type=PRINTER&filetype=.pdf, https://journals.aps.org/prl/pdf/10.1103/PhysRevLett.116.061102, http://resources.edb.gov.hk/physics/articlePic/InterestingTopics/BinaryStars_pic04E.gif
Labels:
Astronomy and Physics,
Black Holes,
Forces,
Universe
Sunday, March 30, 2014
Gravitational Waves 2
This is the second part of a two-part post on gravitational waves. For the first part, see here.
The previous post introduces gravitational waves, and discusses early attempts at their detection, such as LIGO. Despite LIGO's failure to detect these waves, new instruments promise to increase precision, allowing us to find weaker gravitational waves, and other indirect methods have yielded results. Overall, these techniques will give us new methods of observing our Universe.
LIGO, as well as other early laser interferometer observatories such as VIRGO (a similar detector in Italy), are sometimes known as the "first generation" of gravitational wave detectors. During LIGO's operation, upgrades led to modest increases in sensitivity. However, after the temporary cessation of operations in 2010, more major upgrades were made to LIGO including heavier mirrors and more powerful lasers, which will increase sensitivity and reduce background noise caused by thermal energy. The new Advanced LIGO began operation in 2016, and should have a range of hundreds of millions of light years, ten times that of the original design (see diagram below). These upgraded observatories were the "second generation" of detectors.
The original LIGO could detect gravitational wave sources only within our Local supercluster and its neighbors (small gray sphere), but Advanced LIGO was able to scour an volume of space 1000 times as large for gravitational wave signals (the entire scope of the figure above).
The above diagram shows the actual and estimated sensitivities for different gravitational wave detectors, including LIGO, VIRGO, and their respective upgrades. The x-axis of the graph is the frequency of the gravitational wave (gravitational waves have different frequencies in the same way that electromagnetic waves do) and the y-axis indicates the intensity of the waves. The detectors exhibit different sensitivities to different frequencies; curves that dip lower indicate better detectors. The Einstein GW Telescope is a proposed "third-generation" laser interferometer concept, still in design phase. This design would have the facility be underground to reduce seismic noise and cryogenically cooled to prevent thermal vibrations from altering the distance between mirrors.
Another "third-generation" design concept which would theoretically yield numerous detections is the Laser Interferometer Space Antenna (LISA), a spaced-based model.
LISA would consist of three separate spacecraft, which would create a equilateral triangle of side length 5 million kilometers (3.1 million miles). The above diagram is an artist's conception. This triangle would trail the Earth in heliocentric orbit, and would be very sensitive to different frequencies of gravitational waves than ground-based detectors like LIGO.
The above figure shows that LISA would detect much longer wavelengths than Advanced LIGO (due to LISA's enormous arms). Advanced LIGO could only discover very high frequency oscillations, such as neutron stars rotating very close to each other just before colliding. Such systems are rare and short-lived, since neutron star systems contract and ultimately collide. However, LISA could detect more slowly orbiting binary systems, long before their final collision. These are very common, and many are already known through other means of observation, guaranteeing that LISA would find many sources if it functions correctly.
There are unfortunately no definite plans for launching LISA, but a small test mission, known as LISA Pathfinder, launched in 2015. This small probe contained a tiny interferometer meant to test the LISA concept in space and evaluate the proposal's feasibility.
Ultimately, the most important goal of gravitational-wave observatories is to peer farther into the early universe than could be possible with telescopes measuring electromagnetic radiation. Using ordinary visual telescopes (of sufficient power), we can view objects billions of light years away (seeing them as they were billions of years ago, since it takes light a year to travel each light-year). However, there is a fundamental limit to how far these telescopes can see. Before 380,000 years after the Big Bang (or about 13.8 billion years ago), the temperature of the Universe was too high for electrons to combine with atomic nuclei into atoms, and, since electrons scatter electromagnetic radiation, the Universe was opaque. Thus the "oldest" light in the Universe is from 380,000 years after the Big Bang; it is called the Cosmic Microwave Background (CMB), and traditional telescopes cannot see farther. However, gravitational wave astronomy has the potential to receive signals from earlier periods and study them directly, leading to a greater understanding of the Big Bang.
For an update on recent developments in the detection of gravitational waves, see here!
Sources: https://www.advancedligo.mit.edu/summary.html, http://www.ligo.caltech.edu/docs/G/G080303-00.pdf, http://www.et-gw.eu/, http://www.physik.hu-berlin.de/qom/research/freqref/lisa, http://lisa.nasa.gov/, http://cosmology.berkeley.edu/~yuki/CMBpol/CMBpol.htm, http://www.theguardian.com/science/2014/mar/17/primordial-gravitational-wave-discovery-physics-bicep, http://www.nytimes.com/2014/03/25/science/space/ripples-from-the-big-bang.html?_r=0, "An Ear to the Big Bang" from The Scientific American October 2013 issue
The previous post introduces gravitational waves, and discusses early attempts at their detection, such as LIGO. Despite LIGO's failure to detect these waves, new instruments promise to increase precision, allowing us to find weaker gravitational waves, and other indirect methods have yielded results. Overall, these techniques will give us new methods of observing our Universe.
LIGO, as well as other early laser interferometer observatories such as VIRGO (a similar detector in Italy), are sometimes known as the "first generation" of gravitational wave detectors. During LIGO's operation, upgrades led to modest increases in sensitivity. However, after the temporary cessation of operations in 2010, more major upgrades were made to LIGO including heavier mirrors and more powerful lasers, which will increase sensitivity and reduce background noise caused by thermal energy. The new Advanced LIGO began operation in 2016, and should have a range of hundreds of millions of light years, ten times that of the original design (see diagram below). These upgraded observatories were the "second generation" of detectors.
The original LIGO could detect gravitational wave sources only within our Local supercluster and its neighbors (small gray sphere), but Advanced LIGO was able to scour an volume of space 1000 times as large for gravitational wave signals (the entire scope of the figure above).
The above diagram shows the actual and estimated sensitivities for different gravitational wave detectors, including LIGO, VIRGO, and their respective upgrades. The x-axis of the graph is the frequency of the gravitational wave (gravitational waves have different frequencies in the same way that electromagnetic waves do) and the y-axis indicates the intensity of the waves. The detectors exhibit different sensitivities to different frequencies; curves that dip lower indicate better detectors. The Einstein GW Telescope is a proposed "third-generation" laser interferometer concept, still in design phase. This design would have the facility be underground to reduce seismic noise and cryogenically cooled to prevent thermal vibrations from altering the distance between mirrors.
Another "third-generation" design concept which would theoretically yield numerous detections is the Laser Interferometer Space Antenna (LISA), a spaced-based model.
LISA would consist of three separate spacecraft, which would create a equilateral triangle of side length 5 million kilometers (3.1 million miles). The above diagram is an artist's conception. This triangle would trail the Earth in heliocentric orbit, and would be very sensitive to different frequencies of gravitational waves than ground-based detectors like LIGO.
The above figure shows that LISA would detect much longer wavelengths than Advanced LIGO (due to LISA's enormous arms). Advanced LIGO could only discover very high frequency oscillations, such as neutron stars rotating very close to each other just before colliding. Such systems are rare and short-lived, since neutron star systems contract and ultimately collide. However, LISA could detect more slowly orbiting binary systems, long before their final collision. These are very common, and many are already known through other means of observation, guaranteeing that LISA would find many sources if it functions correctly.
There are unfortunately no definite plans for launching LISA, but a small test mission, known as LISA Pathfinder, launched in 2015. This small probe contained a tiny interferometer meant to test the LISA concept in space and evaluate the proposal's feasibility.
Ultimately, the most important goal of gravitational-wave observatories is to peer farther into the early universe than could be possible with telescopes measuring electromagnetic radiation. Using ordinary visual telescopes (of sufficient power), we can view objects billions of light years away (seeing them as they were billions of years ago, since it takes light a year to travel each light-year). However, there is a fundamental limit to how far these telescopes can see. Before 380,000 years after the Big Bang (or about 13.8 billion years ago), the temperature of the Universe was too high for electrons to combine with atomic nuclei into atoms, and, since electrons scatter electromagnetic radiation, the Universe was opaque. Thus the "oldest" light in the Universe is from 380,000 years after the Big Bang; it is called the Cosmic Microwave Background (CMB), and traditional telescopes cannot see farther. However, gravitational wave astronomy has the potential to receive signals from earlier periods and study them directly, leading to a greater understanding of the Big Bang.
For an update on recent developments in the detection of gravitational waves, see here!
Sources: https://www.advancedligo.mit.edu/summary.html, http://www.ligo.caltech.edu/docs/G/G080303-00.pdf, http://www.et-gw.eu/, http://www.physik.hu-berlin.de/qom/research/freqref/lisa, http://lisa.nasa.gov/, http://cosmology.berkeley.edu/~yuki/CMBpol/CMBpol.htm, http://www.theguardian.com/science/2014/mar/17/primordial-gravitational-wave-discovery-physics-bicep, http://www.nytimes.com/2014/03/25/science/space/ripples-from-the-big-bang.html?_r=0, "An Ear to the Big Bang" from The Scientific American October 2013 issue
Saturday, March 22, 2014
Gravitational Waves 1
Gravitational waves, in brief, are the propagations of gravitational fields through space. Before dealing with gravitational waves directly, we attempt to provide historical context and a way to visualize how the waves work.
In 1865, James Clerk Maxwell (1831-1879) published a paper outlining his theory of electromagnetism, compiling and uniting earlier work into a single theory explaining the properties of both electricity and magnetism. For example, it deals with the properties objects possessing positive and negative charges, and the forces they exert on their environments (electric and magnetic fields). This theory also describes electromagnetic waves, or propagating changes in the electromagnetic field. Such waves are characterized by their wavelength and amplitude.
The above simplified diagram of a wave shows its wavelength and amplitude. We also define the frequency of a wave as the number of oscillations per second. In the diagram above, the wave has a frequency of 2 Hz. For electromagnetic waves, amplitude corresponds to intensity of the wave, and wavelength to type (or in the case of visual light, color). The continuous interval of electromagnetic wavelengths is known as the electromagnetic spectrum and includes many familiar types of radiation, including radio waves, microwaves, infrared rays, visible light, ultraviolet rays, X-rays, and gamma rays (all of these types are discussed in the link above).
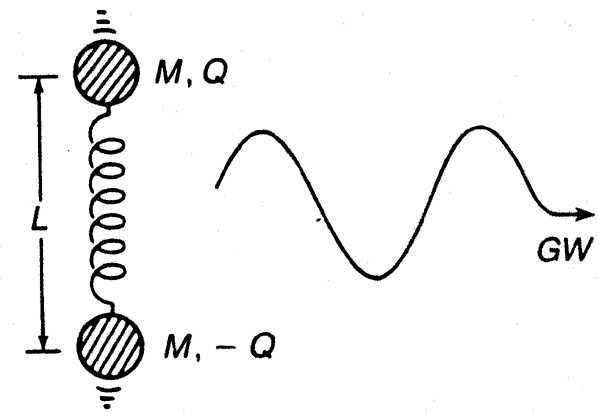
Such waves are produced when charged objects move through space, causing a change in electric field. When a charge has moved, it will not exert the same forces on its surroundings as it had previously. The change in field is "carried" by waves, which move at the speed of light, a finite (though very fast) speed. The diagram below shows an example of electromagnetic wave production by a dipole, or a pair of equal and opposite charges.
As the charges oscillate up and down, an electromagnetic wave is produced, and propagates away from the dipole (the blue and red parts of the oscillation are the electric and magnetic field components, respectively). Since the oscillation is periodic, the wave signal it produces is also periodic. The magnitude of the charges forming the dipole determines the amplitude of the generated wave. Also, the frequency of the oscillation determines the frequency of the electromagnetic waves.
At the beginning 20th century, though Maxwell's theory had supplanted earlier understandings of electromagnetism, Newton's was still the dominant paradigm for gravitation. The theories did have similarities, among them the fact that both electromagnetic and gravitational forces shrank with distance in inverse proportion with the square of this distance (F ~ 1/r2). However, while there were both attractive and repulsive electromagnetic forces, gravity was always an attractive force. Another crucial difference was that, as shown above, electromagnetic fields move at the speed of light. Newton's theory, though, simply assumed that all bodies pulled instantaneously on one another. Albert Einstein (1879-1955) developed the theory of general relativity in 1916 and resolved this difference. His theory predicted that differences in gravitational fields would move analogously to electromagnetic fields: using gravitational waves. Further, these postulated gravitational waves would travel at the speed of light.
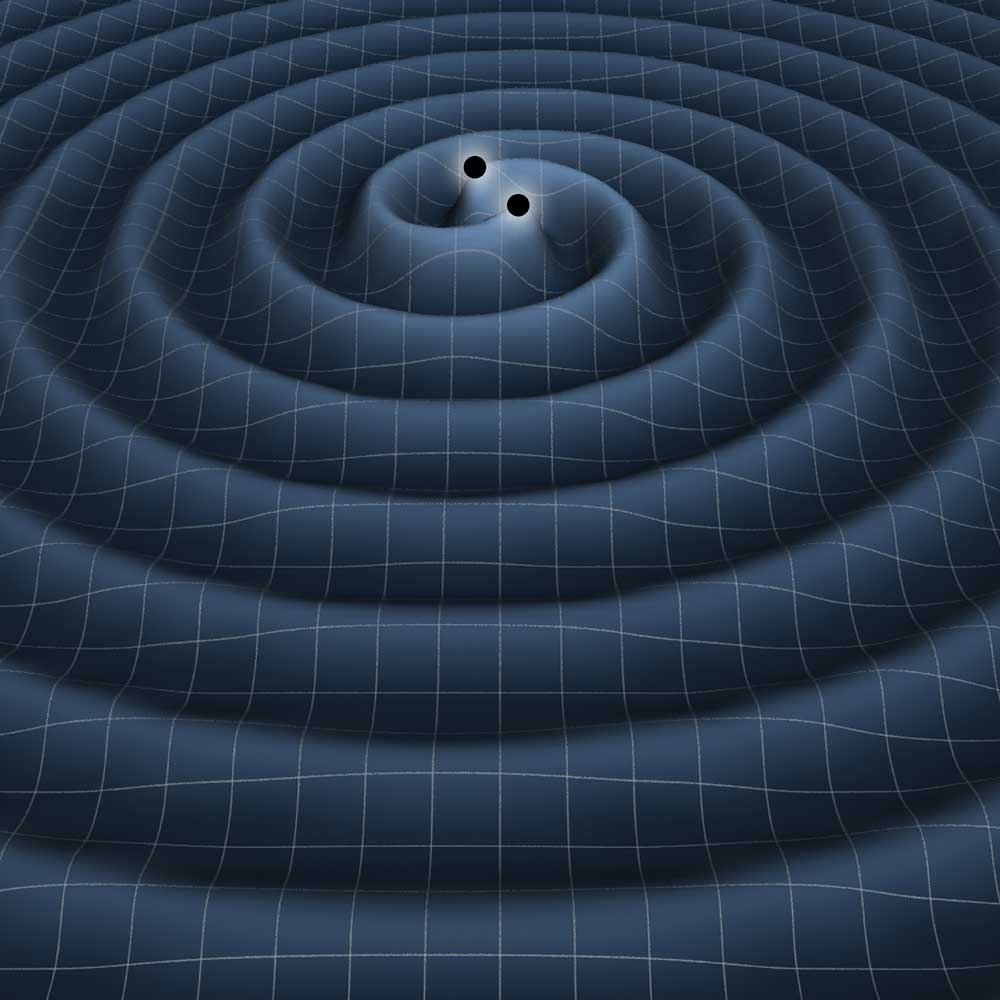
Gravitational waves, in Einstein's theory, would also be produced in an analogous manner to electromagnetic waves. Instead of oscillating charges, oscillating masses would produce the waves. For example, two massive bodies (such as black holes) orbiting one another at close range would produce gravitational radiation, as in the diagram below.
The conception above illustrates how gravitational waves move away from the orbiting system in all directions. Unlike their electromagnetic counterparts, gravitational waves travel undisturbed through matter, and as a consequence are much more difficult to detect. Nevertheless, they do have a subtle effect on the matter which they pass through. The medium through which gravitational waves travel is the fabric of space itself. The diagram above illustrates distortions of a two-dimensional space fabric; in reality, gravitational waves would cause small "ripples" in our three-dimensional space.
Beginning in the 1960's scientists on Earth have constructed increasingly sophisticated gravitational wave detectors. The first variety were known as Weber bars, or large bars of metal which, if sufficiently isolated from the surrounding environment, could oscllate as gravitational waves passed through them. However, the waves had to be very strong to be detected, and the original models were not up to the task. More modern Weber bars have been supercooled to temperatures very near absolute zero to reduce outside vibrations and increase their sensitivity.
Another method for identifying incoming gravitational waves is known as laser interferometry.
Laser interferometry works by using light beams to measure distances. In the usual design (diagram above), a laser creates a beam of light which is split by a beam-splitting mirror into two beams which travel down the two perpendicular arms of the interferometer. On the return trip, if the arms are exactly the same length, the beams interfere with one another in such a way that all the light travels back to the laser. If, however, the arms have slightly different lengths, some light will be reflected by the beam-splitter into a detector.
The Laser Interferometer Gravitational-Wave Observatory (LIGO) wass one project making use of a laser interferometer to detect gravitational waves. In each of LIGO's facilities (there is one in Louisiana and one in Washington) there was a laser inteferometer with arms four kilometers (2.5 miles) long. Theory held that when a gravitational wave passes through the detector, it distorts space and actually alters the lengths of the arms slightly. Since the arms are perpendicular, the distortions are different, and sufficiently strong waves should then cause the laser beams to be enough out of sync to send light to the detector. There were two LIGO stations to weed out false data and to determine which way gravitational waves moved through the Earth. Despite the precision of LIGO, it did not make any unambiguous detections during its operation (2002-2010).
Despite these setbacks, concepts for more precise instruments and new detectors have since been developed, and the road to gravitational wave detection has also proceeded through more indirect means (see the next post).
Sources: http://www.britannica.com/EBchecked/topic/242499/gravity-wave, http://rsta.royalsocietypublishing.org/content/366/1871/1849.full, http://www.tapir.caltech.edu/~teviet/Waves/differences.html, http://www.geo.mtu.edu/~scarn/teaching/GE4250/EM_wave_lecture.pdf, http://ned.ipac.caltech.edu/level5/ESSAYS/Boughn/figure1.gif, http://upload.wikimedia.org/wikipedia/commons/3/35/Onde_electromagnetique.svg, http://www.vias.org/wirelessnetw/img/wndw-print_img_3.png, spaceplace.nasa.gov, http://en.wikipedia.org/wiki/Gravitational-wave_detector, http://www.learner.org/courses/physics/visual/visual.html?shortname=ligo_interfermometer, http://www.ligo-la.caltech.edu/LLO/overviewsci.htm
In 1865, James Clerk Maxwell (1831-1879) published a paper outlining his theory of electromagnetism, compiling and uniting earlier work into a single theory explaining the properties of both electricity and magnetism. For example, it deals with the properties objects possessing positive and negative charges, and the forces they exert on their environments (electric and magnetic fields). This theory also describes electromagnetic waves, or propagating changes in the electromagnetic field. Such waves are characterized by their wavelength and amplitude.
The above simplified diagram of a wave shows its wavelength and amplitude. We also define the frequency of a wave as the number of oscillations per second. In the diagram above, the wave has a frequency of 2 Hz. For electromagnetic waves, amplitude corresponds to intensity of the wave, and wavelength to type (or in the case of visual light, color). The continuous interval of electromagnetic wavelengths is known as the electromagnetic spectrum and includes many familiar types of radiation, including radio waves, microwaves, infrared rays, visible light, ultraviolet rays, X-rays, and gamma rays (all of these types are discussed in the link above).
Such waves are produced when charged objects move through space, causing a change in electric field. When a charge has moved, it will not exert the same forces on its surroundings as it had previously. The change in field is "carried" by waves, which move at the speed of light, a finite (though very fast) speed. The diagram below shows an example of electromagnetic wave production by a dipole, or a pair of equal and opposite charges.
As the charges oscillate up and down, an electromagnetic wave is produced, and propagates away from the dipole (the blue and red parts of the oscillation are the electric and magnetic field components, respectively). Since the oscillation is periodic, the wave signal it produces is also periodic. The magnitude of the charges forming the dipole determines the amplitude of the generated wave. Also, the frequency of the oscillation determines the frequency of the electromagnetic waves.
At the beginning 20th century, though Maxwell's theory had supplanted earlier understandings of electromagnetism, Newton's was still the dominant paradigm for gravitation. The theories did have similarities, among them the fact that both electromagnetic and gravitational forces shrank with distance in inverse proportion with the square of this distance (F ~ 1/r2). However, while there were both attractive and repulsive electromagnetic forces, gravity was always an attractive force. Another crucial difference was that, as shown above, electromagnetic fields move at the speed of light. Newton's theory, though, simply assumed that all bodies pulled instantaneously on one another. Albert Einstein (1879-1955) developed the theory of general relativity in 1916 and resolved this difference. His theory predicted that differences in gravitational fields would move analogously to electromagnetic fields: using gravitational waves. Further, these postulated gravitational waves would travel at the speed of light.
Gravitational waves, in Einstein's theory, would also be produced in an analogous manner to electromagnetic waves. Instead of oscillating charges, oscillating masses would produce the waves. For example, two massive bodies (such as black holes) orbiting one another at close range would produce gravitational radiation, as in the diagram below.
The conception above illustrates how gravitational waves move away from the orbiting system in all directions. Unlike their electromagnetic counterparts, gravitational waves travel undisturbed through matter, and as a consequence are much more difficult to detect. Nevertheless, they do have a subtle effect on the matter which they pass through. The medium through which gravitational waves travel is the fabric of space itself. The diagram above illustrates distortions of a two-dimensional space fabric; in reality, gravitational waves would cause small "ripples" in our three-dimensional space.
Beginning in the 1960's scientists on Earth have constructed increasingly sophisticated gravitational wave detectors. The first variety were known as Weber bars, or large bars of metal which, if sufficiently isolated from the surrounding environment, could oscllate as gravitational waves passed through them. However, the waves had to be very strong to be detected, and the original models were not up to the task. More modern Weber bars have been supercooled to temperatures very near absolute zero to reduce outside vibrations and increase their sensitivity.
Another method for identifying incoming gravitational waves is known as laser interferometry.
Laser interferometry works by using light beams to measure distances. In the usual design (diagram above), a laser creates a beam of light which is split by a beam-splitting mirror into two beams which travel down the two perpendicular arms of the interferometer. On the return trip, if the arms are exactly the same length, the beams interfere with one another in such a way that all the light travels back to the laser. If, however, the arms have slightly different lengths, some light will be reflected by the beam-splitter into a detector.
The Laser Interferometer Gravitational-Wave Observatory (LIGO) wass one project making use of a laser interferometer to detect gravitational waves. In each of LIGO's facilities (there is one in Louisiana and one in Washington) there was a laser inteferometer with arms four kilometers (2.5 miles) long. Theory held that when a gravitational wave passes through the detector, it distorts space and actually alters the lengths of the arms slightly. Since the arms are perpendicular, the distortions are different, and sufficiently strong waves should then cause the laser beams to be enough out of sync to send light to the detector. There were two LIGO stations to weed out false data and to determine which way gravitational waves moved through the Earth. Despite the precision of LIGO, it did not make any unambiguous detections during its operation (2002-2010).
Despite these setbacks, concepts for more precise instruments and new detectors have since been developed, and the road to gravitational wave detection has also proceeded through more indirect means (see the next post).
Sources: http://www.britannica.com/EBchecked/topic/242499/gravity-wave, http://rsta.royalsocietypublishing.org/content/366/1871/1849.full, http://www.tapir.caltech.edu/~teviet/Waves/differences.html, http://www.geo.mtu.edu/~scarn/teaching/GE4250/EM_wave_lecture.pdf, http://ned.ipac.caltech.edu/level5/ESSAYS/Boughn/figure1.gif, http://upload.wikimedia.org/wikipedia/commons/3/35/Onde_electromagnetique.svg, http://www.vias.org/wirelessnetw/img/wndw-print_img_3.png, spaceplace.nasa.gov, http://en.wikipedia.org/wiki/Gravitational-wave_detector, http://www.learner.org/courses/physics/visual/visual.html?shortname=ligo_interfermometer, http://www.ligo-la.caltech.edu/LLO/overviewsci.htm
Saturday, March 5, 2011
Gamma Rays
Gamma rays are the final type of radiation found on the electromagnetic spectrum. Gamma rays have the highest frequency and smallest wavelength of any radiation, and therefore also have the highest energy.
Gamma rays are powerful enough to penetrate most substances, and are powerful ionizers. The gamma ray spectrum involves wavelengths lower than one trillionth of a meter (less than .000000000001 meters).
This radiation is often produced as a byproduct of atomic decay, in which unstable atoms emit energy through gamma rays and other particles before settling to a stable state. Descriptions of some of these reactions can be found here.
Among the parts of the electromagnetic spectrum, gamma rays are comparatively rare. Few objects are powerful enough to give off high amounts of gamma ray energy. However, this radiation is very important on atomic scales, when atomic decay spontaneously converts mass into energetic photons, i.e. gamma rays. This is possible due to the well known mass-energy relation
E=mc^2
where E corresponds to energy, m to mass, and c a constant (the speed of light: 186282 miles per second). The meaning of this equation is that a certain amount of mass is equal to a certain amount of energy. During the early stages of the Universe, the temperature was sufficiently high that particles collided with their antiparticle counterparts. When they collide, they instantly annihilate each other, releasing energy. As energy, the reverse happened, with particles and antiparticles being spontaneously created. Now these reactions only take place in extreme conditions, such as on the edges of a black hole.
Despite this, astronomical gamma ray sources can still be found, and the closest is the Moon.

An image of the Moon taken by a gamma ray telescope. The gamma rays emitted from the Moon originate when other solar ionizing radiation, such as ultraviolet, hits the Moon and causes the excitation of heavy atoms, and this in turn, causes the emission of gamma rays. In contrast, the Sun is nearly invisible in the gamma ray spectrum, because it consists of very light atoms (mostly Hydrogen and Helium) that cannot be excited by ionizing radiation.
Other gamma ray sources include solar flares, the death of massive stars (through processes such as supernovae) and their remnants (neutron stars and black holes), as well as active galaxies. Galaxies are "active" if large amounts of infalling matter are feeding their central black hole, giving off enormous amounts of radiation. Most information on gamma ray bursts is theoretical, as little is actually known about their sources, and they usually are very distant.
Gamma ray bursts and their sources are some of the most fascinating areas of astronomy.
Sources: http://en.wikipedia.org/wiki/Gamma_ray, http://science.hq.nasa.gov/kids/imagers/ems/gamma.html, http://en.wikipedia.org/wiki/Timeline_of_the_Big_Bang, http://en.wikipedia.org/wiki/Mass–energy_equivalence
Gamma rays are powerful enough to penetrate most substances, and are powerful ionizers. The gamma ray spectrum involves wavelengths lower than one trillionth of a meter (less than .000000000001 meters).
This radiation is often produced as a byproduct of atomic decay, in which unstable atoms emit energy through gamma rays and other particles before settling to a stable state. Descriptions of some of these reactions can be found here.
Among the parts of the electromagnetic spectrum, gamma rays are comparatively rare. Few objects are powerful enough to give off high amounts of gamma ray energy. However, this radiation is very important on atomic scales, when atomic decay spontaneously converts mass into energetic photons, i.e. gamma rays. This is possible due to the well known mass-energy relation
E=mc^2
where E corresponds to energy, m to mass, and c a constant (the speed of light: 186282 miles per second). The meaning of this equation is that a certain amount of mass is equal to a certain amount of energy. During the early stages of the Universe, the temperature was sufficiently high that particles collided with their antiparticle counterparts. When they collide, they instantly annihilate each other, releasing energy. As energy, the reverse happened, with particles and antiparticles being spontaneously created. Now these reactions only take place in extreme conditions, such as on the edges of a black hole.
Despite this, astronomical gamma ray sources can still be found, and the closest is the Moon.

An image of the Moon taken by a gamma ray telescope. The gamma rays emitted from the Moon originate when other solar ionizing radiation, such as ultraviolet, hits the Moon and causes the excitation of heavy atoms, and this in turn, causes the emission of gamma rays. In contrast, the Sun is nearly invisible in the gamma ray spectrum, because it consists of very light atoms (mostly Hydrogen and Helium) that cannot be excited by ionizing radiation.
Other gamma ray sources include solar flares, the death of massive stars (through processes such as supernovae) and their remnants (neutron stars and black holes), as well as active galaxies. Galaxies are "active" if large amounts of infalling matter are feeding their central black hole, giving off enormous amounts of radiation. Most information on gamma ray bursts is theoretical, as little is actually known about their sources, and they usually are very distant.
Gamma ray bursts and their sources are some of the most fascinating areas of astronomy.
Sources: http://en.wikipedia.org/wiki/Gamma_ray, http://science.hq.nasa.gov/kids/imagers/ems/gamma.html, http://en.wikipedia.org/wiki/Timeline_of_the_Big_Bang, http://en.wikipedia.org/wiki/Mass–energy_equivalence
Labels:
Astronomy and Physics,
Forces,
Particle Library,
Universe
Friday, February 25, 2011
X-rays
X-rays are yet another type of electromagnetic radiation, which is radiation in the form of photons. X-rays are very high energy, and therefore have a very short wavelength and a very high frequency.
X-rays are the first portion of the electromagnetic spectrum to be ionizing, (high frequency ultraviolet rays also have this property) meaning that they have high enough energy to dislodge electrons from the outer shells of atoms, thus converting them into ions.
This part of the electromagnetic spectrum varies in wavelength from .01 nanometers to 10 nanometers, covering three orders of magnitude. X-rays are primarily used for medical purposes, although they can be carcinogens in larger doses. It is estimated that a common dental X-ray does not meaningfully increase cancer risk, but more invasive CAT scans may significantly increase the risk.

The first known instance of a medical X-ray, taken in 1895 by William Roentgen of his wife's hand. The X-rays penetrate skin but not bone, and the lack of X-rays passing through creates the image above. Note the ring present on the ring finger.
Sheets of lead are often used to contain this radiation, as it is the most cost efficient metal for doing so. Varied thicknesses are used, although 10 mm is sufficient for most X-rays.
In astronomy, X-ray telescopes are used to detect sources of radiation throughout the galaxy. The closest source of X-rays is our Sun, (these are often reflected off the moon) but the Sun predominantly emits light at higher wavelengths, and large sources of X-rays are relatively rare. The accretion disc of a black hole emits large amounts of X-rays as it is heated to extreme temperatures. These sources are particularly prominent when the black hole has a large source of material, e.g. a binary star companion.

An artist's conception of a binary star system in which one of the stars has become a black hole. The gravitational pull from the black hole pulls in material from its companion star, and this material rotates the black hole at extreme speeds, (often over a million miles per hour) causing it to emit X-rays. The most well-known example of a binary system containing a black hole is Cygnus X-1, named for being a strong X-ray source in the constellation Cygnus.

X-ray image of Cygnus X-1 (false-color). The blue supergiant companion star is not prominent in this part of the spectrum, and is therefore not visible.
Other astronomical sources of X-rays include very massive stars, and the supernovae they result in, as well as black holes at galaxy centers. In the former case, the massive stars are often very unstable, and shed material in terrific explosions periodically, culminating in a supernova, in which, huge amounts of X-rays are emitted in an extreme explosion. The latter case works on the same principle as stellar black holes: with accreted matter increasing in temperature and energy, and subsequently releasing X-rays before being sucked in to the black hole.
Sources: http://en.wikipedia.org/wiki/X-ray, http://science.hq.nasa.gov/kids/imagers/ems/xrays.html, http://en.wikipedia.org/wiki/Astrophysical_X-ray_source
X-rays are the first portion of the electromagnetic spectrum to be ionizing, (high frequency ultraviolet rays also have this property) meaning that they have high enough energy to dislodge electrons from the outer shells of atoms, thus converting them into ions.
This part of the electromagnetic spectrum varies in wavelength from .01 nanometers to 10 nanometers, covering three orders of magnitude. X-rays are primarily used for medical purposes, although they can be carcinogens in larger doses. It is estimated that a common dental X-ray does not meaningfully increase cancer risk, but more invasive CAT scans may significantly increase the risk.

The first known instance of a medical X-ray, taken in 1895 by William Roentgen of his wife's hand. The X-rays penetrate skin but not bone, and the lack of X-rays passing through creates the image above. Note the ring present on the ring finger.
Sheets of lead are often used to contain this radiation, as it is the most cost efficient metal for doing so. Varied thicknesses are used, although 10 mm is sufficient for most X-rays.
In astronomy, X-ray telescopes are used to detect sources of radiation throughout the galaxy. The closest source of X-rays is our Sun, (these are often reflected off the moon) but the Sun predominantly emits light at higher wavelengths, and large sources of X-rays are relatively rare. The accretion disc of a black hole emits large amounts of X-rays as it is heated to extreme temperatures. These sources are particularly prominent when the black hole has a large source of material, e.g. a binary star companion.

An artist's conception of a binary star system in which one of the stars has become a black hole. The gravitational pull from the black hole pulls in material from its companion star, and this material rotates the black hole at extreme speeds, (often over a million miles per hour) causing it to emit X-rays. The most well-known example of a binary system containing a black hole is Cygnus X-1, named for being a strong X-ray source in the constellation Cygnus.

X-ray image of Cygnus X-1 (false-color). The blue supergiant companion star is not prominent in this part of the spectrum, and is therefore not visible.
Other astronomical sources of X-rays include very massive stars, and the supernovae they result in, as well as black holes at galaxy centers. In the former case, the massive stars are often very unstable, and shed material in terrific explosions periodically, culminating in a supernova, in which, huge amounts of X-rays are emitted in an extreme explosion. The latter case works on the same principle as stellar black holes: with accreted matter increasing in temperature and energy, and subsequently releasing X-rays before being sucked in to the black hole.
Sources: http://en.wikipedia.org/wiki/X-ray, http://science.hq.nasa.gov/kids/imagers/ems/xrays.html, http://en.wikipedia.org/wiki/Astrophysical_X-ray_source
Labels:
Astronomy and Physics,
Forces,
Particle Library,
Universe
Thursday, February 17, 2011
Ultraviolet Rays
Ultraviolet Light is another type of electromagnetic radiation. It is known as ultraviolet because the frequency of ultraviolet rays are just larger than that of violet visible light (ultra=beyond).
This area of the spectrum has wavelengths as large as 400 nanometers (right on the cusp of visible light) and as small as 10 nanometers. This area is further subdivided into regions, the most well-known of them being UVA, UVB, and UVC, spanning 400-315, 315-280, and 280-100 nanometers, respectively. Unlike many of the former parts of the spectrum, ultraviolet light is primarily blocked from reaching the surface of the Earth. Of the ultraviolet light that does pass through the ozone layer, (perhaps 2% of the radiation that reaches the ozone layer from the Sun) most of it is UVA rays.
UVA rays are beneficial to health in small quantities, as they cause the production of vitamin D. In larger quantities, they cause tanning of the skin, and in excess, sunburn. UVA rays also are emitted from black lights, lights that are just on the edge of ultraviolet, making them partially visible. However, a majority of the light emitted is within the UVA region of the electromagnetic spectrum. and this radiation can cause chemical reactions, allowing a few substances to radiate a glow under UVA light.

An example of this is the security band on a typical U.S. $20 bill. This band is hard to duplicate, discouraging counterfeit.
UVB light (315-280 nm) is the next type (in increasing frequency) of ultraviolet light. It affects the skin in a more negative way, and is the rarer of the two types (UVA and UVB) that penetrate the atmosphere. Radiation in this part of the spectrum is more likely to cause cancer than UVA.
UVC light (280-100 nm) is blocked by the ozone layer, but is sometimes artificially produced on the earth's surface. This type of radiation serves as a disinfectant, as exposure of a microorganism to UVC rays damages its genetic material, resulting in mutations that cause infertility, and shortly after, death. In large exposure, these rays have harmful effects on humans as well. Despite their health hazard, they have practical applications in the disinfection of water and other materials.
The remainder of the ultraviolet spectrum (100-10 nm) is mainly used for astronomical purposes, although the Universe looks fundamentally different in ultraviolet than in visible. The most prominent feature, or, in this case, lack thereof, is the dimness of most stars in ultraviolet. Only stars with surfaces at higher temperatures (very young stars and stars in the final stages of their evolution) appear brightly in this part of the spectrum. The interstellar medium, or the sparse material occupying the space between stars, can be best seen and studied with ultraviolet telescopes. These telescopes must be mounted in space, however, due to the low amount of the radiation that reaches the surface of the Earth.

An image (false-color) of the galaxy Messier 81 seen in ultraviolet light. To obtain colorful images of other galaxies, these images are often combined with the images in visible light to detect more features.
Sources: http://en.wikipedia.org/wiki/Ultraviolet, http://science.hq.nasa.gov/kids/imagers/ems/uv.html, http://www.germsquad.com/home/faqs/6-what-are-uv-c-rays-and-how-can-they-benefit-us.html
This area of the spectrum has wavelengths as large as 400 nanometers (right on the cusp of visible light) and as small as 10 nanometers. This area is further subdivided into regions, the most well-known of them being UVA, UVB, and UVC, spanning 400-315, 315-280, and 280-100 nanometers, respectively. Unlike many of the former parts of the spectrum, ultraviolet light is primarily blocked from reaching the surface of the Earth. Of the ultraviolet light that does pass through the ozone layer, (perhaps 2% of the radiation that reaches the ozone layer from the Sun) most of it is UVA rays.
UVA rays are beneficial to health in small quantities, as they cause the production of vitamin D. In larger quantities, they cause tanning of the skin, and in excess, sunburn. UVA rays also are emitted from black lights, lights that are just on the edge of ultraviolet, making them partially visible. However, a majority of the light emitted is within the UVA region of the electromagnetic spectrum. and this radiation can cause chemical reactions, allowing a few substances to radiate a glow under UVA light.

An example of this is the security band on a typical U.S. $20 bill. This band is hard to duplicate, discouraging counterfeit.
UVB light (315-280 nm) is the next type (in increasing frequency) of ultraviolet light. It affects the skin in a more negative way, and is the rarer of the two types (UVA and UVB) that penetrate the atmosphere. Radiation in this part of the spectrum is more likely to cause cancer than UVA.
UVC light (280-100 nm) is blocked by the ozone layer, but is sometimes artificially produced on the earth's surface. This type of radiation serves as a disinfectant, as exposure of a microorganism to UVC rays damages its genetic material, resulting in mutations that cause infertility, and shortly after, death. In large exposure, these rays have harmful effects on humans as well. Despite their health hazard, they have practical applications in the disinfection of water and other materials.
The remainder of the ultraviolet spectrum (100-10 nm) is mainly used for astronomical purposes, although the Universe looks fundamentally different in ultraviolet than in visible. The most prominent feature, or, in this case, lack thereof, is the dimness of most stars in ultraviolet. Only stars with surfaces at higher temperatures (very young stars and stars in the final stages of their evolution) appear brightly in this part of the spectrum. The interstellar medium, or the sparse material occupying the space between stars, can be best seen and studied with ultraviolet telescopes. These telescopes must be mounted in space, however, due to the low amount of the radiation that reaches the surface of the Earth.

An image (false-color) of the galaxy Messier 81 seen in ultraviolet light. To obtain colorful images of other galaxies, these images are often combined with the images in visible light to detect more features.
Sources: http://en.wikipedia.org/wiki/Ultraviolet, http://science.hq.nasa.gov/kids/imagers/ems/uv.html, http://www.germsquad.com/home/faqs/6-what-are-uv-c-rays-and-how-can-they-benefit-us.html
Labels:
Astronomy and Physics,
Forces,
Particle Library,
Universe
Wednesday, February 9, 2011
Visible Light
Visible light is a type of electromagnetic radiation, and is the only type observable through the naked eye.
Rather than being divided into different bands, visible light is divided into colors. The slight differences in the wavelengths of visible waves determine which color that the light is. Visible light is the "smallest" range of wavelengths of the seven main sections (logarithmically speaking) but it makes up everything we see.

Above: The division of visible light into a spectrum of colors. At the edges of the scale are near ultraviolet (the top) and near infrared (the bottom). The discovery of light as a composition of colors may have come in Isaac Newton's time (c. 1665), when the prism revealed sunlight as made up of light on many different wavelengths.

The prism is able to split visible light into its components because there are slight differences in the speeds of light through glass. Higher wavelengths are faster and have greater refraction angles, causing them to bend more and therefore appear at the bottom of the rainbow shown above. Red and other long wavelengths travel slower and refract at a smaller angle, causing them to be at the "top" of the rainbow above. Real rainbows work in a similar way, when water droplets disperse sunlight into the visible spectrum. This also proves that sunlight has many different wavelengths of light, by no means limited to visible light.
Visible, or optical astronomy, is by far the oldest type, and has been going on since antiquity. Only recently have observations in other parts of the spectrum expanded our knowledge of the heavens.
Sources: http://www.windows2universe.org/sun/spectrum/multispectral_sun_overview.html, http://www.juliantrubin.com/bigten/lightexperiments.html, http://en.wikipedia.org/wiki/Optical_astronomy
Rather than being divided into different bands, visible light is divided into colors. The slight differences in the wavelengths of visible waves determine which color that the light is. Visible light is the "smallest" range of wavelengths of the seven main sections (logarithmically speaking) but it makes up everything we see.

Above: The division of visible light into a spectrum of colors. At the edges of the scale are near ultraviolet (the top) and near infrared (the bottom). The discovery of light as a composition of colors may have come in Isaac Newton's time (c. 1665), when the prism revealed sunlight as made up of light on many different wavelengths.

The prism is able to split visible light into its components because there are slight differences in the speeds of light through glass. Higher wavelengths are faster and have greater refraction angles, causing them to bend more and therefore appear at the bottom of the rainbow shown above. Red and other long wavelengths travel slower and refract at a smaller angle, causing them to be at the "top" of the rainbow above. Real rainbows work in a similar way, when water droplets disperse sunlight into the visible spectrum. This also proves that sunlight has many different wavelengths of light, by no means limited to visible light.
Visible, or optical astronomy, is by far the oldest type, and has been going on since antiquity. Only recently have observations in other parts of the spectrum expanded our knowledge of the heavens.
Sources: http://www.windows2universe.org/sun/spectrum/multispectral_sun_overview.html, http://www.juliantrubin.com/bigten/lightexperiments.html, http://en.wikipedia.org/wiki/Optical_astronomy
Labels:
Astronomy and Physics,
Forces,
Particle Library,
Universe
Tuesday, February 1, 2011
Infrared Rays
Infrared radiation is a type of radiation included in the electromagnetic spectrum. Infrared rays still have a longer wavelength than visible light, but one shorter than radio waves and microwaves.
Infrared is best known as being heat radiation. The shortest infrared rays are very close to being visible to humans, hence the name (Latin infra meaning below, "below red"). However, humans can sense this radiation as heat, and infrared makes up a majority of the radiation that the Earth receives at ground level. Animals absorb heat and emit it themselves, and these phenomena can be captured by thermographic images:

A thermographic image showing two people (false-color).
Infrared radiation is subdivided further into three zones, near-infrared (.7 to 5 microns, or .0000007 to .000005 meters), mid-infrared (5 microns to about 35 microns), and far-infrared (35 microns to about 300 microns). Each zone has separate uses, notably near-infrared for telecommunication, mid-infrared for heat-seeking missiles, and far-infrared for lasers.
The zones are labeled in this way because near-infrared is on the cusp of visible light, while far-infrared has a much longer wavelength. Some living things can naturally "see" into the infrared spectrum, such as some snakes that use a special heat-detecting sense to find live prey.
Infrared rays have many other uses, including night vision and the heating of objects. Infrared cameras are also a valuable resource in meteorology, as the surface of the earth emits more infrared radiation than that of clouds, creating an easy way to analyze cloud height and temperature.

An infrared image of the Atlantic Basin. Clouds of increasing height are brighter white. The image also shows Tropical Storm Richard in the Caribbean. Image taken 10/23/10 12:15 UTC.
Infrared astronomy was pioneered by the man who discovered infrared rays: William Herschel. He is also well known for discovering the planet Uranus, along with two of its moons. His discovery was made while studying the spectrum of visible light produced by a prism. He noted that there was a significant temperature increase outside the visible light spectrum, beyond the red. He performed more tests and concluded that it was indeed a new type of radiation, being absorbed and emitted just like visible light, and also being released in massive quantities from the Sun.
In modern times, near-infrared rays can usually be picked up with a normal optical telescope, as these telescopes often have larger visual ranges than the naked eye, seeing into both near-infrared and near-ultraviolet. As one progresses farther into the infrared spectrum, a vast majority of rays do not reach the surface of the earth. However, telescopes at high altitudes in dry environments can pick these rays up with good efficiency. Telescopes operating in infrared can detect objects behind interstellar dust clouds and within nebulas better than visible light, as they can see the heat emitted from the region.

A photo of the Orion constellation in visible (left) and infrared (right). Although the infrared provides little indication to the exact location of the stars, it detects gas clouds throughout the constellation and other features totally invisible in the optical spectrum.
Overall, infrared rays have important uses, such as telecommunication and lasers, as well as transmitting heat throughout the Universe.
Sources: National Hurricane Center, http://www.ipac.caltech.edu/Outreach/Edu/Regions/irregions.html, http://en.wikipedia.org/wiki/Infrared. http://www.nasa.gov/mission_pages/SOFIA/infrared.html
Infrared is best known as being heat radiation. The shortest infrared rays are very close to being visible to humans, hence the name (Latin infra meaning below, "below red"). However, humans can sense this radiation as heat, and infrared makes up a majority of the radiation that the Earth receives at ground level. Animals absorb heat and emit it themselves, and these phenomena can be captured by thermographic images:

A thermographic image showing two people (false-color).
Infrared radiation is subdivided further into three zones, near-infrared (.7 to 5 microns, or .0000007 to .000005 meters), mid-infrared (5 microns to about 35 microns), and far-infrared (35 microns to about 300 microns). Each zone has separate uses, notably near-infrared for telecommunication, mid-infrared for heat-seeking missiles, and far-infrared for lasers.
The zones are labeled in this way because near-infrared is on the cusp of visible light, while far-infrared has a much longer wavelength. Some living things can naturally "see" into the infrared spectrum, such as some snakes that use a special heat-detecting sense to find live prey.
Infrared rays have many other uses, including night vision and the heating of objects. Infrared cameras are also a valuable resource in meteorology, as the surface of the earth emits more infrared radiation than that of clouds, creating an easy way to analyze cloud height and temperature.

An infrared image of the Atlantic Basin. Clouds of increasing height are brighter white. The image also shows Tropical Storm Richard in the Caribbean. Image taken 10/23/10 12:15 UTC.
Infrared astronomy was pioneered by the man who discovered infrared rays: William Herschel. He is also well known for discovering the planet Uranus, along with two of its moons. His discovery was made while studying the spectrum of visible light produced by a prism. He noted that there was a significant temperature increase outside the visible light spectrum, beyond the red. He performed more tests and concluded that it was indeed a new type of radiation, being absorbed and emitted just like visible light, and also being released in massive quantities from the Sun.
In modern times, near-infrared rays can usually be picked up with a normal optical telescope, as these telescopes often have larger visual ranges than the naked eye, seeing into both near-infrared and near-ultraviolet. As one progresses farther into the infrared spectrum, a vast majority of rays do not reach the surface of the earth. However, telescopes at high altitudes in dry environments can pick these rays up with good efficiency. Telescopes operating in infrared can detect objects behind interstellar dust clouds and within nebulas better than visible light, as they can see the heat emitted from the region.

A photo of the Orion constellation in visible (left) and infrared (right). Although the infrared provides little indication to the exact location of the stars, it detects gas clouds throughout the constellation and other features totally invisible in the optical spectrum.
Overall, infrared rays have important uses, such as telecommunication and lasers, as well as transmitting heat throughout the Universe.
Sources: National Hurricane Center, http://www.ipac.caltech.edu/Outreach/Edu/Regions/irregions.html, http://en.wikipedia.org/wiki/Infrared. http://www.nasa.gov/mission_pages/SOFIA/infrared.html
Labels:
Astronomy and Physics,
Forces,
Particle Library,
Universe
Monday, January 24, 2011
Microwaves
Microwaves are a type of wave in the electromagnetic spectrum (see here). Their wavelengths are longer than any type of wave except for radio waves (see here).
The wavelength of a microwave can range from 1 millimeter (.001 meter) to 1 meter. This range is actually within the broader term radio wave, but on some scales, they are separate. Accordingly, the frequency range of microwaves is 300 MHz to 300 GHz (300,000,000 to 300,000,000,000 Hz).
Microwaves are specifically used in areas such as communication, power, and radar. Before fiber-optic cables were adopted into the phone system, microwaves were used for the same purpose. Radar, or the ability to map objects by bouncing waves off them, lies predominantly within the microwave region, but perhaps the most famous of microwave uses is the microwave oven. Microwave ovens bombard non-radioactive radiation into food, installing energy into, and therefore heating, it.

The main component of the microwave oven is the magnetron. This is a cross-section of such a device which generates an electric field to produce microwaves. Magnetrons are generally for heating certain substances with microwaves, such as water, sugar, and fats in food, and sometimes, humans. Microwaves, however, are not specifically heat radiation.
Microwaves, just like all waves used for communication are divided into bands to organize their use. WIth microwaves, these bands are denoted by letter, (e.g. the L Band, ranging from 1 to 2 GHz) and each band has specific uses.
Yet another use of microwaves is in astronomy. There are many sources of microwaves in the heavens, but the most notable is the Cosmic Microwave Background Radiation. This radiation was emitted 379,000 years of the Big Bang, when the Universe became transparent due to the cessation of photon-plasma reactions. Plasma is ionized gas, and is therefore made of ionized atoms. When the temperature of the Universe had fallen enough to support complete atoms with electrons, the atoms became neutral, and the reactions stopped. The image of the Universe released at that moment was carried by gamma rays, but over time red shifting transferred these into microwaves, as they are today. More and less intense patches on the radiation indicate the density of different parts of the Universe. The differences were minute at the time, but gravity gradually increased the differences, and all of the structure in the large scale Universe was defined.

An image adjusted from the original Cosmic Microwave Background to show temperature differences in the early Universe.
Microwaves have a variety of uses, from communication to heating to discovering the origins of the Universe.
Sources: http://en.wikipedia.org/wiki/Microwave, http://www.gallawa.com/microtech/mwave.html, http://en.wikipedia.org/wiki/Cosmic_microwave_background_radiation, etc.
The wavelength of a microwave can range from 1 millimeter (.001 meter) to 1 meter. This range is actually within the broader term radio wave, but on some scales, they are separate. Accordingly, the frequency range of microwaves is 300 MHz to 300 GHz (300,000,000 to 300,000,000,000 Hz).
Microwaves are specifically used in areas such as communication, power, and radar. Before fiber-optic cables were adopted into the phone system, microwaves were used for the same purpose. Radar, or the ability to map objects by bouncing waves off them, lies predominantly within the microwave region, but perhaps the most famous of microwave uses is the microwave oven. Microwave ovens bombard non-radioactive radiation into food, installing energy into, and therefore heating, it.
The main component of the microwave oven is the magnetron. This is a cross-section of such a device which generates an electric field to produce microwaves. Magnetrons are generally for heating certain substances with microwaves, such as water, sugar, and fats in food, and sometimes, humans. Microwaves, however, are not specifically heat radiation.
Microwaves, just like all waves used for communication are divided into bands to organize their use. WIth microwaves, these bands are denoted by letter, (e.g. the L Band, ranging from 1 to 2 GHz) and each band has specific uses.
Yet another use of microwaves is in astronomy. There are many sources of microwaves in the heavens, but the most notable is the Cosmic Microwave Background Radiation. This radiation was emitted 379,000 years of the Big Bang, when the Universe became transparent due to the cessation of photon-plasma reactions. Plasma is ionized gas, and is therefore made of ionized atoms. When the temperature of the Universe had fallen enough to support complete atoms with electrons, the atoms became neutral, and the reactions stopped. The image of the Universe released at that moment was carried by gamma rays, but over time red shifting transferred these into microwaves, as they are today. More and less intense patches on the radiation indicate the density of different parts of the Universe. The differences were minute at the time, but gravity gradually increased the differences, and all of the structure in the large scale Universe was defined.

An image adjusted from the original Cosmic Microwave Background to show temperature differences in the early Universe.
Microwaves have a variety of uses, from communication to heating to discovering the origins of the Universe.
Sources: http://en.wikipedia.org/wiki/Microwave, http://www.gallawa.com/microtech/mwave.html, http://en.wikipedia.org/wiki/Cosmic_microwave_background_radiation, etc.
Labels:
Astronomy and Physics,
Forces,
Particle Library,
Universe
Sunday, January 16, 2011
Radio Waves
Radio Waves are part of the electromagnetic spectrum (see here) and consist of photons in their wave form. Out of all of the electromagnetic waves, radio waves have the lowest frequency and highest wavelength.
The range of radio waves is approximately 3 Hz, meaning three wavelengths per second, to 300 GHz, or 300,000,000,000 Hz, although the boundary isn't clearly defined, and waves with frequencies even smaller than these exist. This range is equivalent to wavelengths from 1 millimeter (.001 meter) to 100,000 kilometers (100,000,000 meters).
Radio waves are both man-made, and occur from natural sources, and have many uses, due to the fact that most of the radio spectrum pass through Earth's atmosphere intact. The percentage of waves that pass through the atmosphere are shown on the picture below, along with the rest of the spectrum.

Since radio waves can pass through the atmosphere, they are invaluable for communication purposes and information propagation takes place mainly in the radio spectrum. This portion of the spectrum is further divided into powers of 10. For example, the area from 3-30 Hz is known as Extremely Low Frequency (ELF), the area from 30-300 Hz is known as Super Low Frequency (SLF), the area from 300-3,000 Hz (3 kHz) is known as Ultra Low Frequency (ULF) and so on. The chart of frequencies above ULF are shown below.

The first radio waves to be used for communication are AM radio waves, which extend from 148.5 kHz (148,500 Hz) to 30 MHz (30,000,000 Hz). These waves are in the Low, Medium, and High Frequency ranges. However, waves of these frequencies are produced naturally by the ionosphere and magnetic storms, causing interference. As a result, FM radio, falling entirely under the Very High Frequency range, is now used for long distance broad casts. This area of the spectrum is the busiest of all, as television, FM radio and mobile communications all resides within 30-300 MHz.
The very low frequencies, (VLF and lower) are used for military (submarine) communications as they are useful in subaquatic environments.
The higher frequencies also have uses. Super High Frequency (3-30 GHz, or 3,000,000,000-30,000,000,000 Hz) is used for radar, and Extremely High Frequency (30-300 GHz) is used for radio astronomy.

The Very Large Array, located in New Mexico, USA, is used for radio astronomy. Large, parabolic satellite dishes concentrate the signals on a specific sources in the center of each individual telescope. Since many radio waves picked up from space have very long wavelengths, a very large apparatus is needed to capture a reasonable image. The Very Large Area has 27 radio telescope receivers, each 82 feet in diameter, and the images produced by each are compiled into a single one in the center.

This is an optical (visible light) image of the M87 elliptical galaxy. The active center and jet of radiation from it are visible, but in visible light, most of the galaxy is a haze of stars.

However, by use of radio astronomy, a much more specific picture can be taken. Unlike visible light, radio waves are not produced to a great extent by any part of the galaxy except the active center, and it can therefore be identified better in radio astronomy. The above image is taken by the Very Large Array (VLA). However, the bottom image, which is magnified tens of thousands of times more than the above one, is taken by the Very Long Baseline Array (VLBA). Since M87 is over 50 million light years away, a resolution of this magnitude can only be created by use of a planet sized radio telescope, which is essentially what VLBA is. Satellite dishes all over the world are synced together by a central computer in Europe, and therefore at least a small number of radio waves coming in over a Earth-sized area can be put together to get a very precise view, even if all the incoming waves aren't picked up.
Notable sources of radio waves from space include the Sun (only due to its proximity to Earth, because stars do not emit a majority of their energy in radio waves), galactic centers, such as the Milky Way itself, and active ones like M87, neutron stars, and very distant powerfully emitted objects such as quasars. The redshift effect of the quasars' movement away from us causes the waves to lengthen in wavelength as they approach Earth. As a result, many waves that start higher in frequency are radio waves when they reach Earth. This effect is most notable at very long distances, billions of light years away. Among objects at this distance, only quasars are bright enough to be visible, and are therefore excellent subjects of radio astronomy.
Sources: http://www.google.com/imgres?imgurl=http://www.electronics-radio.com/, http://en.wikipedia.org/wiki/Radio_astronomy, etc.
The range of radio waves is approximately 3 Hz, meaning three wavelengths per second, to 300 GHz, or 300,000,000,000 Hz, although the boundary isn't clearly defined, and waves with frequencies even smaller than these exist. This range is equivalent to wavelengths from 1 millimeter (.001 meter) to 100,000 kilometers (100,000,000 meters).
Radio waves are both man-made, and occur from natural sources, and have many uses, due to the fact that most of the radio spectrum pass through Earth's atmosphere intact. The percentage of waves that pass through the atmosphere are shown on the picture below, along with the rest of the spectrum.

Since radio waves can pass through the atmosphere, they are invaluable for communication purposes and information propagation takes place mainly in the radio spectrum. This portion of the spectrum is further divided into powers of 10. For example, the area from 3-30 Hz is known as Extremely Low Frequency (ELF), the area from 30-300 Hz is known as Super Low Frequency (SLF), the area from 300-3,000 Hz (3 kHz) is known as Ultra Low Frequency (ULF) and so on. The chart of frequencies above ULF are shown below.

The first radio waves to be used for communication are AM radio waves, which extend from 148.5 kHz (148,500 Hz) to 30 MHz (30,000,000 Hz). These waves are in the Low, Medium, and High Frequency ranges. However, waves of these frequencies are produced naturally by the ionosphere and magnetic storms, causing interference. As a result, FM radio, falling entirely under the Very High Frequency range, is now used for long distance broad casts. This area of the spectrum is the busiest of all, as television, FM radio and mobile communications all resides within 30-300 MHz.
The very low frequencies, (VLF and lower) are used for military (submarine) communications as they are useful in subaquatic environments.
The higher frequencies also have uses. Super High Frequency (3-30 GHz, or 3,000,000,000-30,000,000,000 Hz) is used for radar, and Extremely High Frequency (30-300 GHz) is used for radio astronomy.

The Very Large Array, located in New Mexico, USA, is used for radio astronomy. Large, parabolic satellite dishes concentrate the signals on a specific sources in the center of each individual telescope. Since many radio waves picked up from space have very long wavelengths, a very large apparatus is needed to capture a reasonable image. The Very Large Area has 27 radio telescope receivers, each 82 feet in diameter, and the images produced by each are compiled into a single one in the center.

This is an optical (visible light) image of the M87 elliptical galaxy. The active center and jet of radiation from it are visible, but in visible light, most of the galaxy is a haze of stars.

However, by use of radio astronomy, a much more specific picture can be taken. Unlike visible light, radio waves are not produced to a great extent by any part of the galaxy except the active center, and it can therefore be identified better in radio astronomy. The above image is taken by the Very Large Array (VLA). However, the bottom image, which is magnified tens of thousands of times more than the above one, is taken by the Very Long Baseline Array (VLBA). Since M87 is over 50 million light years away, a resolution of this magnitude can only be created by use of a planet sized radio telescope, which is essentially what VLBA is. Satellite dishes all over the world are synced together by a central computer in Europe, and therefore at least a small number of radio waves coming in over a Earth-sized area can be put together to get a very precise view, even if all the incoming waves aren't picked up.
Notable sources of radio waves from space include the Sun (only due to its proximity to Earth, because stars do not emit a majority of their energy in radio waves), galactic centers, such as the Milky Way itself, and active ones like M87, neutron stars, and very distant powerfully emitted objects such as quasars. The redshift effect of the quasars' movement away from us causes the waves to lengthen in wavelength as they approach Earth. As a result, many waves that start higher in frequency are radio waves when they reach Earth. This effect is most notable at very long distances, billions of light years away. Among objects at this distance, only quasars are bright enough to be visible, and are therefore excellent subjects of radio astronomy.
Sources: http://www.google.com/imgres?imgurl=http://www.electronics-radio.com/, http://en.wikipedia.org/wiki/Radio_astronomy, etc.
Labels:
Astronomy and Physics,
Forces,
Particle Library,
Universe
Saturday, January 8, 2011
Electromagnetic Spectrum
The Electromagnetic Spectrum, technically speaking, is the range of frequencies that a photon wave can assume. The photon is essentially the particle of light, and this particle has many interesting properties.
First, a photon has no mass, which means it can travel at a speed unlimited by its mass. The speed at which the light particle can travel in a vacuum defines the fastest known speed in the Universe, namely the speed of light, or 186,292 miles per second. Second, the photon can have properties of both a particle and a wave. But when dealing with the electromagnetic spectrum, the wave form of a photon is most important.
The electromagnetic spectrum deals with all possible photon waves, each of which are composed of the same particle, but have different energies. Along with energy, the three properties of a specific electromagnetic wave are amplitude, wavelength and frequency.

Electromagnetic waves are in a sinusoid form, meaning that they are shaped like the red line above. The distance, A, from the sinusoid axis to the peak of the curve is known as the amplitude of the wave, and the distance between peaks is known as the wavelength, while the distance between crossings of the sinusoid axis are half of a wavelength. The remaining element, frequency, is how many wavelengths the wave goes through over a certain period of time. The horizontal axis (x) on the graph above is the passage of time, and over this time, the wave modulates, or moves from peak to peak, in a cyclic manner.

The different electromagnetic waves are separated by varying amplitude and wavelength. The above chart shows five different wave types. The horizontal axis represents time, as before. On the top of the chart is the wave with the highest wavelength, but lowest frequency, and as one goes down the chart, the wavelength decreases and the frequency increases. The two properties are inversely proportional because an electromagnetic wave is traveling at a constant speed through a vacuum, the speed of light, and therefore the wavelength determines a length of time between wave peaks, namely frequency. Wavelength is measured in meters, while frequency is measured in a unit called a Hertz (Hz), with 1 Hz meaning one wavelength per second.

The entire electromagnetic spectrum (click to enlarge), including names given to specific areas of the spectrum, some uses of particular wavelengths, and the corresponding wavelength and frequency axes. The plot is a log scale of base 10, meaning that instead of counting up 1, 2, 3... the graph counts 10^1, 10^2, 10^3... The frequency increases from the bottom to the top, starting at 10^6, and ending at 10^19, and the wavelength counts in meters (m), using symbols like cm to represent increments of meters.
The waves are as follows, from lowest to highest frequency are: radio waves, microwaves, infrared rays, visible light, ultraviolet rays, X-rays, and gamma rays. Each of these have their own individual posts. Click on one to enter and begin exploring the electromagnetic spectrum.
First, a photon has no mass, which means it can travel at a speed unlimited by its mass. The speed at which the light particle can travel in a vacuum defines the fastest known speed in the Universe, namely the speed of light, or 186,292 miles per second. Second, the photon can have properties of both a particle and a wave. But when dealing with the electromagnetic spectrum, the wave form of a photon is most important.
The electromagnetic spectrum deals with all possible photon waves, each of which are composed of the same particle, but have different energies. Along with energy, the three properties of a specific electromagnetic wave are amplitude, wavelength and frequency.

Electromagnetic waves are in a sinusoid form, meaning that they are shaped like the red line above. The distance, A, from the sinusoid axis to the peak of the curve is known as the amplitude of the wave, and the distance between peaks is known as the wavelength, while the distance between crossings of the sinusoid axis are half of a wavelength. The remaining element, frequency, is how many wavelengths the wave goes through over a certain period of time. The horizontal axis (x) on the graph above is the passage of time, and over this time, the wave modulates, or moves from peak to peak, in a cyclic manner.

The different electromagnetic waves are separated by varying amplitude and wavelength. The above chart shows five different wave types. The horizontal axis represents time, as before. On the top of the chart is the wave with the highest wavelength, but lowest frequency, and as one goes down the chart, the wavelength decreases and the frequency increases. The two properties are inversely proportional because an electromagnetic wave is traveling at a constant speed through a vacuum, the speed of light, and therefore the wavelength determines a length of time between wave peaks, namely frequency. Wavelength is measured in meters, while frequency is measured in a unit called a Hertz (Hz), with 1 Hz meaning one wavelength per second.

The entire electromagnetic spectrum (click to enlarge), including names given to specific areas of the spectrum, some uses of particular wavelengths, and the corresponding wavelength and frequency axes. The plot is a log scale of base 10, meaning that instead of counting up 1, 2, 3... the graph counts 10^1, 10^2, 10^3... The frequency increases from the bottom to the top, starting at 10^6, and ending at 10^19, and the wavelength counts in meters (m), using symbols like cm to represent increments of meters.
The waves are as follows, from lowest to highest frequency are: radio waves, microwaves, infrared rays, visible light, ultraviolet rays, X-rays, and gamma rays. Each of these have their own individual posts. Click on one to enter and begin exploring the electromagnetic spectrum.
Labels:
Astronomy and Physics,
Forces,
Particle Library,
Universe
Saturday, January 1, 2011
Radioactive Decay
Radioactive Decay is the decomposition of an unstable atom into multiple parts. Often, this involves the emission of radiation, hence the name radioactive decay. Some elements of the periodic table have no stable atoms, while some have stable and unstable isotopes, meaning that the number of protons remains the same, but stability can vary with the number of neutrons.
There are 118 known elements on the periodic table, and, among these, numbers 43, 61, and all above 82 possess only isotopes that are radioactive. The remaining 80 have at least one neutron number that results in a stable nucleus, but a vast majority of the possibilities are radioactive, and overcome the force, known as the strong nuclear force or the strong interaction, that binds the particles in a nucleus together.
For example, the element oxygen has 8 protons, and the number of neutrons can range from 4 to 16, because it is known that there are physical limits on how many neutrons can exist for a certain number of protons, called the nuclear drip line. It is simply impossible for 3 neutrons and 8 protons to exist in a nucleus, and if these particles are shoved together, a proton will simply drip out. Similarly, it is impossible for 8 protons and 17 neutrons to be together in a nucleus, because a neutron will "drip" out. Therefore, these nuclei do not qualify as parts of atoms, as they are never in a whole state. Unlike these, isotopes of oxygen between 4 and 16 neutrons can exist. However, all but three of these are unstable, and decay to other atoms within seconds. Atoms with 8 protons and 8, 9, and 10 neutrons, corresponding to Oxygen-16, Oxygen-17, and Oxygen-18 are stable, and occur in nature.
Also, there are different ways that atoms can decay into others. The three most common were the first types of radiation isolated, and there were named alpha, beta, and gamma decay.
Alpha decay involves an unstable nucleus of an atom emitting an entire Helium-4 nucleus, that is, two protons and two neutrons, at once. This nucleus is also known as an alpha particle. The resulting nucleus of the parent atom has two less protons and two less neutrons than it did before alpha decay. Some argue that the Helium nucleus takes two electrons with it when an atom experiences alpha decay, because otherwise there would be an unbalanced charge, and some believe that two electrons are simply released into the environment. An example alpha decay reaction is pictured below.

An example reaction involves Uranium-238, which, by alpha decay loses two neutrons and two protons. Because of this the resulting atom's atomic weight will drop from 238 to 234, and the atomic number will drop by two, becoming Thorium. Therefore the reaction is denoted
238,92U=234,92Th+4,2He
The notation above shows the two balanced sides of the reaction, with the Uranium-238 (first number before the atomic symbol is the entire weight, the second is the number of protons) atom on the left, and the Thorium-234 atom and the Helium nucleus (alpha particle) on the right. In this reaction the two elections are assumed to leave the atom with the Helium nucleus.
Beta decay involves a slightly more complicated chain of events, and there are two types: Beta negative and beta positive, denoted B- and B+ respectively. The B- reaction uses the weak nuclear force (one of the four fundamental forces of the Universe) to convert a neutron into a proton. However, there are some byproducts of this reaction, namely an electron and an electron antineutrino. Since a neutron is only slightly heavier than the proton, the loss of a tiny electron (and an electron antineutrino) is enough to convert it into a proton. Also, the change is mass is so minute that the atomic weight remains the same, but the atomic number goes up. This type of decay actually "increases" the complexity of the nucleus, instead of lowering it.

This image is an example beta decay reaction. The main picture shows only the B- particle (electron) being emitted, while the inset shows the entire reaction. The neutron splits into three parts, of which the proton stays in the nucleus, the B- particle may leave the atom or stay and compensate for the gaining of a positive charge via the proton, and the tiny electron antineutrino is emitted. To fully understand this process, one must break it down into even smaller stages, by use of a Feynman Diagram.

A Feynman Diagram graphically represents quantum phenomena to make them easier to understand. In this diagram, time progresses with respect to the vertical axis. The neutron, n, is shown as its three composite parts, u,d, and d, representing one up quark and two down quarks. The weak nuclear force has an effect on the final down quark only, instantly changing it to an up quark. As a result, the three new quarks are up, down, up (u,d,u) and these are the composite particles for a proton, hence the proton end product. However, to make this change happen, a W- boson, the carrier of the weak nuclear force, must be emitted from the down quark, to change it to an up quark. Since a down quark is heavier than an up one, the loss in mass again makes sense. The W- boson is very short lived, however, and nearly instantaneously splits into an electron and an electron antineutrino, denoted by the e- and ve+ respectively.
An example reaction of B- decay is the process of changing the Caesium-137 atom into the Barium-137 atom
137,55Cs = 137,56Ba + e- + ve+
Neutron-rich nuclei are more likely to undergo B- decay.
The other type of Beta decay is B+ decay. It is basically the opposite (in terms of particles) of the previous process, because a proton is converted into a neutron. Since the neutron is heavier than the proton, the reaction needs outside energy to add mass to the reaction (since energy can at any time by changed into mass and vice versa). This must be provided by the environment, and therefore this reaction cannot occur by itself in a vacuum. The byproducts of the reaction are the opposite of B- decay in charge; instead of a electron and an electron antineutrino being emitted, the positron (anti-electron) and electron neutrino are emitted. An example B+ decay reaction involving the transformation of Carbon-11 into Boron-11 is written below
11,6C = 11,5B + e+ + ve-
This reaction also involves the weak nuclear force, but with use of a W+ boson, rather than a W- one. The W+ boson is emitted when a up quark changes into a down quark. This particle then splits into the two mentioned above.
B+ decay is more likely to occur in proton-rich nuclei.
There are other rarer types of Beta decay, such as electron capture, where an electron is "captured" from the orbitals of the atom, and is pulled to the nucleus, where it combines with a proton to form a neutron and an electron antineutrino. An example reaction is
59,28Ni + e- = 59,27Co + ve+
Although the electron on the left side of this equation is presented as if it is separate from the atom, the electron actually originated from what was part of the atom, namely orbiting electrons.
There are also forms of Beta decay where the process happens twice simultaneously. These are called Double Beta Decay, and a similar double exists for electron capture.
Other simple types of radioactive decay include proton emission, if a nucleus is very rich in protons, and neutron emission, if a nucleus is very rich in protons. Note that this is different from proton and neutron "dripping" discussed earlier, because the nucleus does exist as one unit before the the proton or neutron is emitted.
Another famous type is the emission of a larger particle than an alpha particle, namely a heavier atomic nucleus. However, this type of decay, called cluster decay, only occurs among atoms that usually decay through the emission of an alpha particle. Some unstable atoms decay in different ways, with one occurring a certain percentage of the time, and another in the remaining percentage. An example is the atom Radium-223.
Usually, Radium-223 decays through alpha decay:
223,88Ra = 219,86Rn + 4,2He
but for one out of every one billion reactions, something else occurs, and the atom emits a Carbon-14 nucleus!
223,88Ra = 209,82Pb + 14,6C
The second reaction was the first of its kind known to occur and was discovered in 1984 at Oxford University. The heaviest known nucleus to be emitted in this fashion is Silicon-34, happening only once out of trillions and trillions of alpha decays from Plutonium-240, Americium-241, and Curium-242.
Finally, some atoms simply split into two atoms, through a process called spontaneous fission. This processes occurs when a neutron impacts the nucleus and splits it in two. Uranium, Plutonium, and Californium are three elements that have a chance for spontaneous fission, although they are more likely to decay through other processes. Californium-252 has a relatively high fission rate, with 3.09% of reactions result in fission. However, Uranium-235 decays through fission only seven reactions out of 100 billion! There are higher elements which predominately decay by fission, some of which are isotopes of Mendelevium and Rutherfordium. Some of these reactions emit neutrons in turn, and these can lead to chain reactions. Uranium-235 is one of these, and since each reaction gives out energy, it is one of the isotopes used in the detonation of atomic bombs.
Reactions of this type occur to all of the possible unstable isotopes. The chart that maps all the isotopes is known as the table of nuclides, linked to here.

This is another version of the table of nuclides, which shows the predominant mode of decay for every known nuclide. The center of the band of nuclides are the most stable (those in black are stable), and they tend to get less stable away from the center. Isotopes that undergo B+ decay or Proton Emission occur on the right (proton-rich) side of the stable isotopes, while ones that undergo B- decay or Neutron Emission occur the left (neutron-rich) side of the stable isotopes. Also, alpha decay, cluster decay and fission tend to occur with heavier atoms, toward the upper right of the chart.
Some isotopes do not decay directly into a stable nucleus, and go through multiple steps of decay before reaching stability.
-1.PNG.png)
An example is Uranium-238. Its decay chain is imaged above (click to enlarge), with each octagon containing the atomic number and mass of an isotope, while the arrows denote the decay chain, with letters representing the type of decay. The half-life, or average time to decay on each step, is also included under each octagon. Sometimes, the decay chain branches, when there are probabilities for other types of decay, but all of the branches converge on the stable isotope Lead-206.
Radioactive decay produces energy, and is therefore valuable as a potential power source, with drawbacks including lower feasibility and harmful radiation. Radiation is also used for other purposes, such as medical procedures, specifically for eliminating cancerous cells.
Sources: http://education.jlab.org/glossary/betadecay.gif, http://www.nature.com/nature/journal/v307/n5948/abs/307245a0.html, http://en.wikipedia.org/wiki/Table_of_nuclides_(complete)
There are 118 known elements on the periodic table, and, among these, numbers 43, 61, and all above 82 possess only isotopes that are radioactive. The remaining 80 have at least one neutron number that results in a stable nucleus, but a vast majority of the possibilities are radioactive, and overcome the force, known as the strong nuclear force or the strong interaction, that binds the particles in a nucleus together.
For example, the element oxygen has 8 protons, and the number of neutrons can range from 4 to 16, because it is known that there are physical limits on how many neutrons can exist for a certain number of protons, called the nuclear drip line. It is simply impossible for 3 neutrons and 8 protons to exist in a nucleus, and if these particles are shoved together, a proton will simply drip out. Similarly, it is impossible for 8 protons and 17 neutrons to be together in a nucleus, because a neutron will "drip" out. Therefore, these nuclei do not qualify as parts of atoms, as they are never in a whole state. Unlike these, isotopes of oxygen between 4 and 16 neutrons can exist. However, all but three of these are unstable, and decay to other atoms within seconds. Atoms with 8 protons and 8, 9, and 10 neutrons, corresponding to Oxygen-16, Oxygen-17, and Oxygen-18 are stable, and occur in nature.
Also, there are different ways that atoms can decay into others. The three most common were the first types of radiation isolated, and there were named alpha, beta, and gamma decay.
Alpha decay involves an unstable nucleus of an atom emitting an entire Helium-4 nucleus, that is, two protons and two neutrons, at once. This nucleus is also known as an alpha particle. The resulting nucleus of the parent atom has two less protons and two less neutrons than it did before alpha decay. Some argue that the Helium nucleus takes two electrons with it when an atom experiences alpha decay, because otherwise there would be an unbalanced charge, and some believe that two electrons are simply released into the environment. An example alpha decay reaction is pictured below.

An example reaction involves Uranium-238, which, by alpha decay loses two neutrons and two protons. Because of this the resulting atom's atomic weight will drop from 238 to 234, and the atomic number will drop by two, becoming Thorium. Therefore the reaction is denoted
238,92U=234,92Th+4,2He
The notation above shows the two balanced sides of the reaction, with the Uranium-238 (first number before the atomic symbol is the entire weight, the second is the number of protons) atom on the left, and the Thorium-234 atom and the Helium nucleus (alpha particle) on the right. In this reaction the two elections are assumed to leave the atom with the Helium nucleus.
Beta decay involves a slightly more complicated chain of events, and there are two types: Beta negative and beta positive, denoted B- and B+ respectively. The B- reaction uses the weak nuclear force (one of the four fundamental forces of the Universe) to convert a neutron into a proton. However, there are some byproducts of this reaction, namely an electron and an electron antineutrino. Since a neutron is only slightly heavier than the proton, the loss of a tiny electron (and an electron antineutrino) is enough to convert it into a proton. Also, the change is mass is so minute that the atomic weight remains the same, but the atomic number goes up. This type of decay actually "increases" the complexity of the nucleus, instead of lowering it.

This image is an example beta decay reaction. The main picture shows only the B- particle (electron) being emitted, while the inset shows the entire reaction. The neutron splits into three parts, of which the proton stays in the nucleus, the B- particle may leave the atom or stay and compensate for the gaining of a positive charge via the proton, and the tiny electron antineutrino is emitted. To fully understand this process, one must break it down into even smaller stages, by use of a Feynman Diagram.

A Feynman Diagram graphically represents quantum phenomena to make them easier to understand. In this diagram, time progresses with respect to the vertical axis. The neutron, n, is shown as its three composite parts, u,d, and d, representing one up quark and two down quarks. The weak nuclear force has an effect on the final down quark only, instantly changing it to an up quark. As a result, the three new quarks are up, down, up (u,d,u) and these are the composite particles for a proton, hence the proton end product. However, to make this change happen, a W- boson, the carrier of the weak nuclear force, must be emitted from the down quark, to change it to an up quark. Since a down quark is heavier than an up one, the loss in mass again makes sense. The W- boson is very short lived, however, and nearly instantaneously splits into an electron and an electron antineutrino, denoted by the e- and ve+ respectively.
An example reaction of B- decay is the process of changing the Caesium-137 atom into the Barium-137 atom
137,55Cs = 137,56Ba + e- + ve+
Neutron-rich nuclei are more likely to undergo B- decay.
The other type of Beta decay is B+ decay. It is basically the opposite (in terms of particles) of the previous process, because a proton is converted into a neutron. Since the neutron is heavier than the proton, the reaction needs outside energy to add mass to the reaction (since energy can at any time by changed into mass and vice versa). This must be provided by the environment, and therefore this reaction cannot occur by itself in a vacuum. The byproducts of the reaction are the opposite of B- decay in charge; instead of a electron and an electron antineutrino being emitted, the positron (anti-electron) and electron neutrino are emitted. An example B+ decay reaction involving the transformation of Carbon-11 into Boron-11 is written below
11,6C = 11,5B + e+ + ve-
This reaction also involves the weak nuclear force, but with use of a W+ boson, rather than a W- one. The W+ boson is emitted when a up quark changes into a down quark. This particle then splits into the two mentioned above.
B+ decay is more likely to occur in proton-rich nuclei.
There are other rarer types of Beta decay, such as electron capture, where an electron is "captured" from the orbitals of the atom, and is pulled to the nucleus, where it combines with a proton to form a neutron and an electron antineutrino. An example reaction is
59,28Ni + e- = 59,27Co + ve+
Although the electron on the left side of this equation is presented as if it is separate from the atom, the electron actually originated from what was part of the atom, namely orbiting electrons.
There are also forms of Beta decay where the process happens twice simultaneously. These are called Double Beta Decay, and a similar double exists for electron capture.
Other simple types of radioactive decay include proton emission, if a nucleus is very rich in protons, and neutron emission, if a nucleus is very rich in protons. Note that this is different from proton and neutron "dripping" discussed earlier, because the nucleus does exist as one unit before the the proton or neutron is emitted.
Another famous type is the emission of a larger particle than an alpha particle, namely a heavier atomic nucleus. However, this type of decay, called cluster decay, only occurs among atoms that usually decay through the emission of an alpha particle. Some unstable atoms decay in different ways, with one occurring a certain percentage of the time, and another in the remaining percentage. An example is the atom Radium-223.
Usually, Radium-223 decays through alpha decay:
223,88Ra = 219,86Rn + 4,2He
but for one out of every one billion reactions, something else occurs, and the atom emits a Carbon-14 nucleus!
223,88Ra = 209,82Pb + 14,6C
The second reaction was the first of its kind known to occur and was discovered in 1984 at Oxford University. The heaviest known nucleus to be emitted in this fashion is Silicon-34, happening only once out of trillions and trillions of alpha decays from Plutonium-240, Americium-241, and Curium-242.
Finally, some atoms simply split into two atoms, through a process called spontaneous fission. This processes occurs when a neutron impacts the nucleus and splits it in two. Uranium, Plutonium, and Californium are three elements that have a chance for spontaneous fission, although they are more likely to decay through other processes. Californium-252 has a relatively high fission rate, with 3.09% of reactions result in fission. However, Uranium-235 decays through fission only seven reactions out of 100 billion! There are higher elements which predominately decay by fission, some of which are isotopes of Mendelevium and Rutherfordium. Some of these reactions emit neutrons in turn, and these can lead to chain reactions. Uranium-235 is one of these, and since each reaction gives out energy, it is one of the isotopes used in the detonation of atomic bombs.
Reactions of this type occur to all of the possible unstable isotopes. The chart that maps all the isotopes is known as the table of nuclides, linked to here.

This is another version of the table of nuclides, which shows the predominant mode of decay for every known nuclide. The center of the band of nuclides are the most stable (those in black are stable), and they tend to get less stable away from the center. Isotopes that undergo B+ decay or Proton Emission occur on the right (proton-rich) side of the stable isotopes, while ones that undergo B- decay or Neutron Emission occur the left (neutron-rich) side of the stable isotopes. Also, alpha decay, cluster decay and fission tend to occur with heavier atoms, toward the upper right of the chart.
Some isotopes do not decay directly into a stable nucleus, and go through multiple steps of decay before reaching stability.
-1.PNG.png)
An example is Uranium-238. Its decay chain is imaged above (click to enlarge), with each octagon containing the atomic number and mass of an isotope, while the arrows denote the decay chain, with letters representing the type of decay. The half-life, or average time to decay on each step, is also included under each octagon. Sometimes, the decay chain branches, when there are probabilities for other types of decay, but all of the branches converge on the stable isotope Lead-206.
Radioactive decay produces energy, and is therefore valuable as a potential power source, with drawbacks including lower feasibility and harmful radiation. Radiation is also used for other purposes, such as medical procedures, specifically for eliminating cancerous cells.
Sources: http://education.jlab.org/glossary/betadecay.gif, http://www.nature.com/nature/journal/v307/n5948/abs/307245a0.html, http://en.wikipedia.org/wiki/Table_of_nuclides_(complete)
Labels:
Astronomy and Physics,
Forces
Monday, May 4, 2009
Heat and Its Relation to the Early Universe
Heat is what we depend on for life, warmth, and the existence of galaxies, stars, and planets. However, heat had another meaning in the very early Universe. Heat equaled movement and instability and the huge amount of heat caused particles to move around and annihilate each other causing chaos and confusion. Much of these hyperactive particles' movement happened in the first second of the Universe, creating what we know today. To encompass all temperatures, the Kelvin scale is used. Beginning at room temperature, or 293 K, we begin our journey into extreme heat, and the fascinating phenomena that occur there.
At 310 K, or 98.4 F, is the average temperature of the human body, closely followed by the boiling point of water, at 373.15 K. Note that all main states of matter of water occur naturally: solid, liquid and gas. However, the gas form, water vapor, can be attained in average temperatures by the Sun's heat and the movement of particles. At 1900 K, we reach the temperature of the nose of the Space Shuttle, during re-entry. The supercharged ionosphere (filled with ionized gas, hence the name) is a factor, along with friction, that heats the spacecraft to this temperature. As you get higher, metals start to boil, such as lead, which boils into a gas at 2022 K, or about 4000 degrees Fahrenheit.
At 3000 K, we reach our first important milestone on the backwards journey towards the Big Bang on the scale of extreme heat. The Universe had settled down to this still extreme temperature about 380,000 years after the Big Bang. It is at this time that the Cosmic Background Radiation was emitted* (see footnote below this paragraph). In fact, this is the first time that the Universe was transparent. The Cosmic Background Radiation wasn't emitted until this time, because electrons and anti-electrons (the electron's antimatter pair) were still annihilating each other and turning into photons. In the case of antimatter, there were approximately one million antiparticles for every one million and one regular particles. On contact the pairs destroyed each other and became photons. And the next second, the photons would transmit their energy into mass, and immediately create another electron and another anti-electron. This process stopped when the temperature dropped below 3000 K because the photons lost energy as the Universe expanded, and eventually, they didn't have enough energy to become electrons anymore. Gamma rays are the only waves that have enough energy to produce such particles. Overall, after this time, the net result was one particle left for every one million original particle pairs, (note that this slight amount of matter left in the Universe became everything we know today: galaxies, planets and stars) and a whole bunch of photons. These photons have been causing the Cosmic Background Radiation ever since, for the past 13.7 billion years. This also is the first time in the Universe that complete atoms existed.
*Note that I could call it the Cosmic Microwave Background Radiation as it is called today, but I will refrain from doing so due to the fact that the radiation originated as gamma and X-rays and over time, the wave lost energy and became a microwave. The different waves are distinguished by their frequency, or the distance between "crests" in the curvy line that is the wave. The frequency of the CBR (this of course being the acronym for Cosmic Background Radiation) drops as the Universe expands, and thus if the Universe continues to expand the frequency will get longer and longer, until all Cosmic Background Radiation will become radio waves.
Suddenly, we jump to 13,000,000 K, the temperature required for the proton-proton cycle and the fusion of Hydrogen nuclei into Helium nuclei. (see the post Burning Hydrogen) This is also the temperature of the Sun's core, and the temperature in the Universe about 20 minutes after its formation. This temperature in the early Universe formed the first atomic nuclei heavier than H1. (the Hydrogen nucleus consisting of one proton) The process in which the first Helium, Lithium, and Deuterium atoms were formed in this time period was called Big Bang Nucleosythesis. Big Bang Nucleosythesis lasted approximately from 3-20 minutes after the Big Bang. At this time, hyperactive electrons were still at the point where they couldn't settle down into completed atoms, and real atoms (electrons and all) weren't formed until a while after. This is because of the ongoing electron-photon reactions, see above.

The proton-proton cycle of fusion in the Sun. Notice how neutrinos (marked v) and the positrons (anti-electrons represented by white dots) are emitted during the reaction. Also, the gamma rays are the heat and energy released from the reaction, and absorbed by the Earth. The process begins with four Hydrogen nuclei and ends with one Helium nucleus.
At 10 billion K, atomic nuclei break down and proton and anti-proton reactions occur. This temperature occurred naturally in the Universe at about one second after the Big Bang. This milestone in temperature marked the end of the hadron epoch, which lasted from one millionth of a second to one second after the Big Bang. As with electron and anti-electrons, protons and anti-protons annihilate each other on contact, forming photons. Also, since a byproduct of this reaction is the production of the tiny neutrino (a small particle possessing nearly no mass), a wave of neutrinos was released at the end of the epoch, forming the less known brother of the Cosmic Background Radiation, the Cosmic Neutrino Radiation. Since the neutrinos move at close to the speed of light, and the speed of them is known, they would probably be an even more accurate Universe clock-if they could be detected. Unlike other particles, neutrinos are so minuscule that they pass directly through ordinary matter, and barely ever make contact with other particles, such as protons. In fact, the Sun emits so many of these tiny particles that in the time that it takes to say "neutrino", 50 trillion of these particles pass through you!
At about 1,000,000,000,000 or one trillion K, the heat breaks down the hadrons themselves into the even tinier particles inside them, the quarks. The Universe dropped below this temperature at one millionth of a second after the Big Bang, at before this, from one trillionth to one millionth of a second after the creation of the Universe, was the Quark Epoch. During this epoch, the entire Universe was a sea of quarks and gluons. The gluon is the (somewhat hypothetical) particle that binds quarks together into hadrons. The substance of the Universe during this time was quark-gluon plasma, (for more info on plasma, see here) or a sea of ionized quarks mixed with gluons. Before this point however, the four forces of the Universe: gravity (the force that pulls heavy objects together), electromagnetism (the connections and effects of electricity and magnetism), the weak nuclear force (the force that causes radioactive decay) and the strong nuclear force (the force that binds protons and neutrons together in the nucleus, and, at a smaller scale, also binds together quarks within particles such as protons and neutrons) start to break down and the physics we know today start to change even at fundamental levels.

A representation of the internal structure of a proton. The quarks labeled "u" are up quarks and each have a charge of 2/3. The quark labeled "d" is a down quark and has a charge of -1/3. The wavy lines represented the strong nuclear force, carried by the gluon. Notice that the charges of the quarks, 2/3+2/3-1/3=1 add to form a charge of +1, which is the charge of a proton.
At one trillionth of a second after the Big Bang, the forces begin to unify. The first two forces to unify are the electromagnetic force and the weak nuclear force, forming what is called the electroweak force. This state only can occur at a temperature at about 1,000,000,000,000,000 K, or one million billion Kelvin. To unify these forces in theory, one must come up with a set of physical and mathematical laws that cover both forces. This has already been done for the electroweak force. The strongly hypothetical particles that carry these forces have been explained and unified, but beyond this, it gets even trickier.
At higher than 1,000,000,000,000,000,000,000,000,000 K, or one million billion trillion K, the next unification occurs, this time between the electroweak force and the strong nuclear force to form what is known as the electronuclear force. The theory connecting all three of these forces is called the Grand Unification Theory. This unites nearly all of quantum physics. This force only existed during the Grand Unification Epoch (aptly named) from 10^-43 seconds to 10^-36 seconds after the Big Bang. The electroweak and the strong nuclear force have been unified in theory, but there is still some disagreement about the force's exact nature.
Finally, we reach the hottest, densest, shortest epoch of this Universe, in which the remaining fundamentals of physics break down. This epoch is named the Planck epoch, named after Max Planck. Max Planck discovered the smallest units of length and time as well as others, and discovered the maximum possible temperature and density, as well as others. I go into detail about the Planck units in the post, The Planck Constant and Its Applications. The Universe up to 10^-43 seconds is the time when it was younger than the Planck time, a possibility not nearly explained by any modern theory. It is theorized that the electronuclear force now combines with gravity, at a soaring 14,000,000,000,000,000,000,000,000,000,000,000 K, or the Planck temperature. The theory that covers this is called (very appropriately) the Theory of Everything. This theory would unify gravitation and quantum physics into a theory that explains all phenomena that have and will occur in our Universe. The String Theory and Quantum Loop Gravity Theory have both attempted to explain this, but appear to have failed in encompassing everything. Hopefully, in the future, theories will shed light on this unknown epoch.
Therefore, extreme heat starts by boiling metal, and then breaking down particles, and finally by unifying all that there is in the Universe.
At 310 K, or 98.4 F, is the average temperature of the human body, closely followed by the boiling point of water, at 373.15 K. Note that all main states of matter of water occur naturally: solid, liquid and gas. However, the gas form, water vapor, can be attained in average temperatures by the Sun's heat and the movement of particles. At 1900 K, we reach the temperature of the nose of the Space Shuttle, during re-entry. The supercharged ionosphere (filled with ionized gas, hence the name) is a factor, along with friction, that heats the spacecraft to this temperature. As you get higher, metals start to boil, such as lead, which boils into a gas at 2022 K, or about 4000 degrees Fahrenheit.
At 3000 K, we reach our first important milestone on the backwards journey towards the Big Bang on the scale of extreme heat. The Universe had settled down to this still extreme temperature about 380,000 years after the Big Bang. It is at this time that the Cosmic Background Radiation was emitted* (see footnote below this paragraph). In fact, this is the first time that the Universe was transparent. The Cosmic Background Radiation wasn't emitted until this time, because electrons and anti-electrons (the electron's antimatter pair) were still annihilating each other and turning into photons. In the case of antimatter, there were approximately one million antiparticles for every one million and one regular particles. On contact the pairs destroyed each other and became photons. And the next second, the photons would transmit their energy into mass, and immediately create another electron and another anti-electron. This process stopped when the temperature dropped below 3000 K because the photons lost energy as the Universe expanded, and eventually, they didn't have enough energy to become electrons anymore. Gamma rays are the only waves that have enough energy to produce such particles. Overall, after this time, the net result was one particle left for every one million original particle pairs, (note that this slight amount of matter left in the Universe became everything we know today: galaxies, planets and stars) and a whole bunch of photons. These photons have been causing the Cosmic Background Radiation ever since, for the past 13.7 billion years. This also is the first time in the Universe that complete atoms existed.
*Note that I could call it the Cosmic Microwave Background Radiation as it is called today, but I will refrain from doing so due to the fact that the radiation originated as gamma and X-rays and over time, the wave lost energy and became a microwave. The different waves are distinguished by their frequency, or the distance between "crests" in the curvy line that is the wave. The frequency of the CBR (this of course being the acronym for Cosmic Background Radiation) drops as the Universe expands, and thus if the Universe continues to expand the frequency will get longer and longer, until all Cosmic Background Radiation will become radio waves.
Suddenly, we jump to 13,000,000 K, the temperature required for the proton-proton cycle and the fusion of Hydrogen nuclei into Helium nuclei. (see the post Burning Hydrogen) This is also the temperature of the Sun's core, and the temperature in the Universe about 20 minutes after its formation. This temperature in the early Universe formed the first atomic nuclei heavier than H1. (the Hydrogen nucleus consisting of one proton) The process in which the first Helium, Lithium, and Deuterium atoms were formed in this time period was called Big Bang Nucleosythesis. Big Bang Nucleosythesis lasted approximately from 3-20 minutes after the Big Bang. At this time, hyperactive electrons were still at the point where they couldn't settle down into completed atoms, and real atoms (electrons and all) weren't formed until a while after. This is because of the ongoing electron-photon reactions, see above.

The proton-proton cycle of fusion in the Sun. Notice how neutrinos (marked v) and the positrons (anti-electrons represented by white dots) are emitted during the reaction. Also, the gamma rays are the heat and energy released from the reaction, and absorbed by the Earth. The process begins with four Hydrogen nuclei and ends with one Helium nucleus.
At 10 billion K, atomic nuclei break down and proton and anti-proton reactions occur. This temperature occurred naturally in the Universe at about one second after the Big Bang. This milestone in temperature marked the end of the hadron epoch, which lasted from one millionth of a second to one second after the Big Bang. As with electron and anti-electrons, protons and anti-protons annihilate each other on contact, forming photons. Also, since a byproduct of this reaction is the production of the tiny neutrino (a small particle possessing nearly no mass), a wave of neutrinos was released at the end of the epoch, forming the less known brother of the Cosmic Background Radiation, the Cosmic Neutrino Radiation. Since the neutrinos move at close to the speed of light, and the speed of them is known, they would probably be an even more accurate Universe clock-if they could be detected. Unlike other particles, neutrinos are so minuscule that they pass directly through ordinary matter, and barely ever make contact with other particles, such as protons. In fact, the Sun emits so many of these tiny particles that in the time that it takes to say "neutrino", 50 trillion of these particles pass through you!
At about 1,000,000,000,000 or one trillion K, the heat breaks down the hadrons themselves into the even tinier particles inside them, the quarks. The Universe dropped below this temperature at one millionth of a second after the Big Bang, at before this, from one trillionth to one millionth of a second after the creation of the Universe, was the Quark Epoch. During this epoch, the entire Universe was a sea of quarks and gluons. The gluon is the (somewhat hypothetical) particle that binds quarks together into hadrons. The substance of the Universe during this time was quark-gluon plasma, (for more info on plasma, see here) or a sea of ionized quarks mixed with gluons. Before this point however, the four forces of the Universe: gravity (the force that pulls heavy objects together), electromagnetism (the connections and effects of electricity and magnetism), the weak nuclear force (the force that causes radioactive decay) and the strong nuclear force (the force that binds protons and neutrons together in the nucleus, and, at a smaller scale, also binds together quarks within particles such as protons and neutrons) start to break down and the physics we know today start to change even at fundamental levels.

A representation of the internal structure of a proton. The quarks labeled "u" are up quarks and each have a charge of 2/3. The quark labeled "d" is a down quark and has a charge of -1/3. The wavy lines represented the strong nuclear force, carried by the gluon. Notice that the charges of the quarks, 2/3+2/3-1/3=1 add to form a charge of +1, which is the charge of a proton.
At one trillionth of a second after the Big Bang, the forces begin to unify. The first two forces to unify are the electromagnetic force and the weak nuclear force, forming what is called the electroweak force. This state only can occur at a temperature at about 1,000,000,000,000,000 K, or one million billion Kelvin. To unify these forces in theory, one must come up with a set of physical and mathematical laws that cover both forces. This has already been done for the electroweak force. The strongly hypothetical particles that carry these forces have been explained and unified, but beyond this, it gets even trickier.
At higher than 1,000,000,000,000,000,000,000,000,000 K, or one million billion trillion K, the next unification occurs, this time between the electroweak force and the strong nuclear force to form what is known as the electronuclear force. The theory connecting all three of these forces is called the Grand Unification Theory. This unites nearly all of quantum physics. This force only existed during the Grand Unification Epoch (aptly named) from 10^-43 seconds to 10^-36 seconds after the Big Bang. The electroweak and the strong nuclear force have been unified in theory, but there is still some disagreement about the force's exact nature.
Finally, we reach the hottest, densest, shortest epoch of this Universe, in which the remaining fundamentals of physics break down. This epoch is named the Planck epoch, named after Max Planck. Max Planck discovered the smallest units of length and time as well as others, and discovered the maximum possible temperature and density, as well as others. I go into detail about the Planck units in the post, The Planck Constant and Its Applications. The Universe up to 10^-43 seconds is the time when it was younger than the Planck time, a possibility not nearly explained by any modern theory. It is theorized that the electronuclear force now combines with gravity, at a soaring 14,000,000,000,000,000,000,000,000,000,000,000 K, or the Planck temperature. The theory that covers this is called (very appropriately) the Theory of Everything. This theory would unify gravitation and quantum physics into a theory that explains all phenomena that have and will occur in our Universe. The String Theory and Quantum Loop Gravity Theory have both attempted to explain this, but appear to have failed in encompassing everything. Hopefully, in the future, theories will shed light on this unknown epoch.
Therefore, extreme heat starts by boiling metal, and then breaking down particles, and finally by unifying all that there is in the Universe.
Labels:
Astronomy and Physics,
Forces,
Universe
Subscribe to:
Posts (Atom)