Monday, June 28, 2021

Tropical Storm Danny (2021)

Storm Active: June 28-29

Around June 26, a surface trough well southeast of Bermuda was producing some scattered thunderstorm activity as it moved rather quickly west-northwestward. Ocean waters beneath the disturbance weren't especially warm, nor the atmosphere too moist, but some gradual organization occurred nevertheless. Early on the 28th, it was apparent that a well-defined center of circulation had developed, and the system was classified Tropical Depression Four. At the time, it was a very small, sheared system off the South Carolina coastline.

The depression's track was a little unusual: a strong high was situated over the eastern seaboard, which kept Four moving quickly west-northwestward toward land. The system had a rather high pressure reading of 1013 mb due to ambient high pressures in the surrounding area and this shallowness also contributed to its fast forward motion in the strong low-level flow. In any case, warm waters near the coast allowed the storm to strengthen a bit around landfall and it became Tropical Storm Danny. It made landfall during the evening of the 28th a little north of the Georgia-South Carolina border. Because the cyclone was small, heavy rain and tropical storm force winds were confined to a small region.

After landfall, the storm deterioriated rapidly. It weakened to a tropical depression overnight and dissipated the next morning over central Georgia.


The above image shows the tiny Tropical Storm Danny just before landfall in South Carolina.


Danny was another short-lived tropical cyclone because it formed so close to land.

Saturday, June 19, 2021

Tropical Storm Claudette (2021)

Storm Active: June 19-21

Around June 12, a broad area of low pressure associated loosely with the central American gyre (CAG) to the south formed in the southern Bay of Campeche. It was producing occasional bursts of thunderstorm activity and some spin was evident on satellite imagery, but the size of the system and its proximity to land inhibited tropical cyclone development. The low barely moved for the next several days. It finally made some northward progress starting on June 17 toward a weakness in the subtropical ridge. It was quite disorganized though, with the only convection a band northeast of the ill-defined center.

The disturbance changed little the next day as it approached the northern coastline of the Gulf of Mexico, though aircraft and satellite measurements indicated that it possessed sustained wind speeds to gale force. Heavy rain swept across southeastern Louisiana as the system approached. It was only early on the 19th, as the center was moving over land, that it finally became organized enough to be named Tropical Storm Claudette, with peak winds of 45 mph. However, the classification of the system changed its impacts little; flooding was the primary concern as it moved inland and turned northeast, crossing into Mississippi. Claudette weakened to a tropical depression later on June 19.

An approaching cold front steered the system east-northeast across the southeast United States, bringing scattered downpours and gusty winds with it. The next day, as Claudette approached the Atlantic, the proximity to water fueled some convective redevelopment and the cyclone began to strengthen again. It became a tropical storm again on June 21 near the coast. Forunately, it was fast-moving, and was swept out along the mid-latitude westerlies in short order. After passing over the Gulf stream, it encountered cooler waters. The center was still not well-defined, and Claudette lost its identity as it sped away from land that evening.


As with many storms forming from CAG's, Claudette was a rather messy cyclone; it never looked completely tropical. 2020's Tropical Storm Cristobal was similar in this regard, and was another June CAG storm. Such systems develop most often in June or October/November.


Unusually, Claudette spent more time over land as a tropical cyclone than it did over water!

Monday, June 14, 2021

Tropical Storm Bill (2021)

Storm Active: June 14-15

On June 13, a non-tropical low pressure center developed just off the coast of the southeastern United States in association with a stalled warm front. It moved northeastward a little farther from land and encountered the hot waters of the Gulf stream; sea surface temperature anomalies were extremely high just off of the North Carolina. By the morning of June 14, a burst of convection had covered the low. It was designated Tropical Depression Two shortly after.

The system strengthened steadily during the next day despite moderate wind shear. As a result it was upgraded to Tropical Storm Bill. It also accelerated significantly on its northeastward path. By the afternoon of the 15th, Bill had reached its peak intensity of 60 mph winds, but was already beginning extratropical transition. The central thundestorm activity was displaced from the center by strong upper-level winds and the cyclone became extratropical that evening.


The above image shows Bill as a tropical storm on June 15.


Bill formed near land, but rapidly moved out to sea during its brief stint as a tropical cyclone.

Sunday, May 23, 2021

Tropical Storm Ana (2021)

Storm Active: May 22-23

Around May 20, a low pressure system developed east of Bermuda. At first, it was non-tropical, an elongated low with an attached frontal boundary on the southeastern side. However, it acquired some tropical characteristics as it moved generally in a counterclockwise loop over the next day or two. Ocean temperatures were below the usual threshold for supporting tropical development, but some cool air aloft drove enough instability for thundestorm activity to pop up near the low's center by early on May 22. The system was already producing gale force winds by this point. It had a small radius of maximum winds, a characteristic indicative of a tropical cyclone, but it was embedded in an upper-level low. Because of the latter, it was named Subtropical Storm Ana that morning, the first named storm of the 2021 Atlantic hurricane season. With Ana's formation, 2021 marked the seventh consecutive season with a storm forming before the traditional start date of June 1.

Later that day, Ana's center came within 175 miles (280 km) of Bermuda to the northeast, but the central area of thunderstorms was so small that the island received little more than showers and gusty winds. That evening, Ana began a more definite movement toward the northeast as it felt the flow of an upper-level trough exiting Atlantic Canada. This took the small storm away from the safe haven of low wind shear under its upper-level low. Related to this, Ana transitioned to a fully tropical storm by early on the 23rd. This didn't do much to alter the storm's fate; moving northeast over even colder waters and harsh shear, it weakened to a tropical depression and then degenerated to a remnant low that evening.


The image above shows Ana as a subtropical storm shortly after naming.


Ana was a small and short-lived cyclone with no land impacts.

Monday, May 17, 2021

Professor Quibb's Picks – 2021

My personal prediction for the 2021 North Atlantic Hurricane season (written May 16, 2021) is as follows:

17 cyclones attaining tropical depression status,
16 cyclones attaining tropical storm status,
8 cyclones attaining hurricane status,
5 cyclones attaining major hurricane status.

I predict that the 2021 season will feature above-average activity, though not at the pace of the record-breaking 2020 season. Every decade, the NOAA revises the 30-year averages for number of cyclones to reflect new data and better track climate change; the 1991-2020 averages were 14.4 tropical storms, 7.2 hurricanes, and 3.2 major hurricanes, up from 12.1 tropical storms, 6.4 hurricanes, and 2.7 major hurricanes in the 1981-2010 period. My forecast therefore exceeds this new average, but not by a great deal.

In making this prediction, I first consider the El Niño Southern Oscillation (ENSO) index, which measures sea surface temperature anomalies in the equitorial Pacific ocean. Warmer than normal temperatures (El Niño) correlate to decreased Atlantic activity (and increased Pacific activity) and cooler than normal temperatures (La Niña) the opposite. A La Niña event, the strongest in nearly a decade, is currently ongoing and began in the latter half of 2020, contributing to the frenzy of activity of that season.
Nevertheless, recent data indicate that the La Niña is waning and models generally show this should continue into the summer (see the above graph - the vertical axis indicates the relevant temperature anomaly). However, the ensemble average still indicates ENSO neutral to negative conditions. Overall, I predict lingering La Niña effects will still boost activity this year.

In the same vein, most of the 21st century has been in the positive phase of the theorized Atlantic Multidecadal Oscillation, which has led to elevated sea surface temperatures, and, generally, more hurricanes. It's hard to disentangle such long-term climate cycles from modern anthropogenic global warming, and the headline regarding ocean temperatures is largely the same as the last few years: the Atlantic, Caribbean, and Gulf of Mexico will be warm, even by recent standards. The largest anomalies are likely once again to be in the subtropical Atlantic.


A few other factors that influence tropical cyclone formation are relative humidity of the atmosphere and wind shear. A moist atmosphere allows nascent tropical disturbances to develop thunderstorm activity and grow. Wind shear refers to a change in wind direction and speed between the lower levels and upper levels of the atmosphere; higher values of wind shear hamper tropical cyclones because they prevent them from becoming or remaining vertically stacked. Long-term models can give at least some sense of what average conditions to expect during peak hurricane season (see above: the top figure shows expected precipitation anomalies for August-October 2021 and the bottom zonal wind shear anomalies for the same period). Using these and a few other factors, I'll give a finer analysis of the risks by region. My estimates are on a scale from 1 (least risk) to 5 (most risk).

U.S. East Coast: 3
A mixed bag of conditions leaves the U.S. east coast with middling risk. Indications are that the summer will be wet in this region, with ample heat and moisture for tropical cyclones to form and strengthen. On the other hand, the Bermuda high looks a bit weaker than usual given the neutral to negative ENSO index, suggesting that hurricane tracks might veer east out to sea. With neutral ENSO more likely late in the year, expect fall fronts to reduce east coast risk by the end of September; if there are landfalls here, it will be in the front end of the season.

Yucatan Peninsula and Central America: 2
After a devastating 2020, these areas will (hopefully) experience much less hurricane activity this year. Preciptation forecasts (see above) anticipate a drier west Caribbean, and while wind shear will be lower than average in most of the basin, the same is not true for the eastern Caribbean, where threats to the Yucatan and Central America could form. If hurricanes do affect this region, I'd expect it to be in October and November; rapid intensification episodes close to land are the primary risk.

Caribbean Islands: 5
Even in the most active season in history last year, tropical cyclone activity in the main development region in the tropics between the Windwards and Africa was lackluster. Things will probably be different this year. The dusty Saharan Air Layer (SAL), and its suffocating effect on east Atlantic tropical waves, looks to be less prominent than usual. Furthermore, shear is low, temperatures are warm, and precipitation anomalies are at least around neutral over the tropical Atlantic. This could open the door for some long-track hurricanes à la 2017. The biggest question mark is whether these will avoid land or not, but everywhere from the Lesser Antilles to the Bahamas should be on high alert.

Gulf of Mexico: 4
Though maybe a little dry, the Gulf may have the highest sea surface temperature anomalies outside the subtropical Atlantic this summer. Storms forming near the Bahamas and homegrown hurricanes in the Gulf are both likely to occur at sometime in the year, putting this region at above-average risk.

Overall, I expect the 2021 Atlantic hurricane season to be above-average, though not exceptionally so. Nevertheless, this is just an amateur forecast. Individuals in hurricane-prone areas should always have emergency measures in place. For more on hurricane safety sources, see here. Remember, devastating storms can occur even in otherwise quiet seasons.


Sources: https://www.cpc.ncep.noaa.gov/products/analysis_monitoring/lanina/enso_evolution-status-fcsts-web.pdf, https://www.tropicaltidbits.com, https://www.trackthetropics.com/saharan-air-layer-sal-tracking/, https://www.wunderground.com/hurricane/articles/wind-shear-explainerhttp://www.webberweather.com

Thursday, May 6, 2021

Hurricane Names List – 2021

The name list for tropical cyclones forming in the North Atlantic basin for the year 2021 is as follows:

Ana
Bill
Claudette
Danny
Elsa
Fred
Grace
Henri
Ida
Julian
Kate
Larry
Mindy
Nicholas
Odette
Peter
Rose
Sam
Teresa
Victor
Wanda

This list is the same as the list for the 2015 season, with the exception of Elsa and Julian, which replaced Erika and Joaquin, respectively, after those names were retired.

Friday, January 1, 2021

Sting Jets

Early on October 15, 1987, an innocuous low-pressure system was moving across the Bay of Biscay off the west coast of France. Within one day, it became one of the most strongest windstorms in European history. Poorly anticipated, the storm produced hurricane-force sustained winds for hours over portions of Great Britain and France as well as absurdly strong gusts. The highest measured during the storm was 135 mph, corresponding to category 4 on the hurricane Saffir-Simpson scale (the cyclone was not tropical, however, so the word "hurricane" did not apply). Subsequently known simply as the "Great Storm of 1987," it prompted further study of the mechanisms by which extratropical storms produce extreme winds.


The above satellite image shows the Great Storm of 1987 with a long frontal "tail" extending all the way down to the Canary Islands.

By the time of the Great Storm, the overall genesis process for extratropical cyclones was well understood. The energy for extratropical cyclone formation ultimately derives from temperature differences: cold air from the polar regions meets warm air from the subtropics, usually between 30 and 60 degrees latitude north and south. At these interfaces, there are differences in air pressure at the same altitude in the atmosphere since cold air is denser than warm. This instability provides the energy to drive cyclone formation.


Under the right circumstances, small perturbations in the flow along a boundary of air masses can trigger the formation of a low-pressure system, as indicated above. The cyclonically rotating boundaries between warm and cold air become the warm and cold fronts that control weather in the mid-latitudes. Note that all diagrams, including that above, are the correct orientations in the Northern Hemisphere: the directions of spin would be reversed south of the equator. Our concern in this post is investigating where the strongest surface winds occur in these extratropical storms.


The above schematic shows major low-level winds associated with an extratropical cyclone at different stages of development. These are typical of a rapidly developing and strong storm, which is assumed to be moving northeast. As the storm ramps up, the dominant feature is the mild and wet Warm Conveyor Belt (WCB). This feeds the center a supply of moisture; indeed, nearly all the precipitation occurs ahead (east) of the advancing cold front boundary. Windy conditions can accompany the WCB, but they are not usually too extreme.

In the wake of the cold front comes the chilly and dry Cold Conveyor Belt (CCB). Most intense in a mature storm, this feature often packs stronger winds than the WCB, though they occur after precipitation has passed. Both of these are large-scale, well-understood features, but could not account for the unusually strong surface winds observed in some rapidly intensifying storms. It is the third feature above that fills in the gap: the so-called Sting Jet (SJ).

Named for the "sting at the end of the tail", the sting jet occurs near the very tip of the cloud head, where the bent-back cold front in the diagram above ends. This feature occurs most commonly in cyclones that explosively intensify or "bomb cyclones". The technical definition for this is a pressure drop of 24 mb or more in a period of 24 hours. As shown in the diagram below, just east of this "tail" of the cloud structure, instability causes dry air to descend from high in the atmosphere. Below this is the sting jet. It is a smaller feature compared to the CCB and WCB, about 100 km wide instead of several hundred. This conveyor belt of air is pushed toward the ground by the intruding dry air above.


Typically, friction with the land (or ocean) keeps winds near the surface lower than the strongest winds a few thousand feet above sea level. However, the descending site jet can transport these strong winds quickly to the surface. Moreover, the sting jet comes just head of the CCB (written CJ in the above picture) out of the south or southwest. In a cyclone moving northeast, these winds align with the storm's direction of motion, boosting them even higher. The result: localized but extremely intense wind gusts at the ground, associated with little to no precipitation.

Nearly all documented examples of sting jets are associated with north Atlantic storms impacting Europe. Since the Great Storm of 1987, roughly a dozen more examples have been positively identified. Satellite data indicate that further events likely occur over water where surface observations are sparse. Few studies have investigated the occurrence of sting jets elsewhere around the world, but explosive intensification of extratropical cyclones also occurs in the northwest Pacific and near Antarctica. Fortunately, comparable events in these regions have far fewer human impacts.

A thorough survey of the causes of sting jets is beyond the scope of this post; however, our understanding of this phenomenon is far from complete. Computer models struggle to resolve the feature, especially its tendency to "fan out" in to many small jets near the surface. As a result, predicting these events is still difficult. There is a lot on the line: the Great Storm of 1987 killed 22 people and caused billions in damages. Hopefully, future advances in advance warning will avert the worst impacts of these powerful storms.

Sources: https://journals.ametsoc.org/jcli/article/30/14/5455/97090/Sting-Jet-Windstorms-over-the-North-Atlantic, https://www.metoffice.gov.uk/weather/learn-about/weather/types-of-weather/wind/sting-jet, https://rmets.onlinelibrary.wiley.com/doi/abs/10.1256/qj.02.143, https://rams.atmos.colostate.edu/at540/fall03/fall03Pt5.pdf, https://www.britannica.com/science/cyclogenesis, https://rmets.onlinelibrary.wiley.com/doi/pdf/10.1002/qj.3267

Friday, December 18, 2020

2020 Season Summary

The 2020 Atlantic hurricane season was extremely active, with a total of

31 cyclones attaining tropical depression status,
30 cyclones attaining tropical storm status,
14* cyclones attaining hurricane status, and
7* cyclones attaining major hurricane status.

Before the beginning of the season, I predicted that there would be

20 cyclones attaining tropical depression status,
18 cyclones attaining tropical storm status,
9 cyclones attaining hurricane status, and
5 cyclones attaining major hurricane status.


*The operational number of hurricanes was 13 and major hurricanes 6, but Gamma was upgraded to a hurricane and Zeta to a major hurricane in post-season analysis.

The average numbers of named storms, hurricanes, and major hurricanes for an Atlantic hurricane season (over the 30 year period 1981-2010) are 12.1, 6.4, and 2.7, respectively. The unprecedented activity of the 2020 season vastly exceeded both these averages and my preditions, above average though they were. With an astonishing 30 named storms, 2020 surpassed 2005's record of 28. Its 14 hurricanes became second-most on record (behind only 2005 with 15), and its 7 major hurricanes tied 2005 for the most ever recorded. 2020 was the second season to use the Greek alphabet to name cyclones after exhausting the 21 names on the ordinary list, and the first to use the Greek letters "Eta", "Theta", and "Iota". The Accumulated Cyclone Energy (ACE) value for the 2020 season (which accounts for duration and intensity of storms as well as number) was around 180, in the "hyperactive" range.

2020 also set a smattering of other activity records. For the third named storm and the fifth onward, each formation was the earliest for that number storm on record. The season had five hurricanes of at least category 4 strength, tying a record. A total of ten storms were named in September, surpassing the previous busiest Septembers of 2002 and 2010, each with eight. This busy month included three storms being (operationally) named the same day: on September 18, Tropical Storm Wilfred, Subtropical Storm Alpha, and Tropical Storm Beta all received names. This was only the second time in the hurricane database that such an event occurred, after August 15, 1893. Note, however, that the post-season analysis on Alpha found that it had in fact formed one day earlier, on September 17. 2020 was the first time three major hurricanes had formed in the month of October. November also had three named storms (tied for most), and two major hurricanes (a first).


Illustrating just how active September was, the above image shows the Atlantic on September 14, when there were five (!) cyclones existing simultaneously. Hurricane Sally is visible, strengthening in the Gulf of Mexico, Hurricane Paulette is off of the east coast of North America, a weakening Tropical Depression Rene is a sheared blob east-southeast of Paulette, Tropical Storm Teddy is strengthening in the tropical Atlantic halfway between the Lesser Antilles and Africa, and a recently formed Tropical Storm Vicky is northeast of Teddy. As if that were not enough, the tropical wave that gave rise to the short-lived Tropical Storm Wilfred can be seen in the bottom-right corner emerging from Africa, as can the disturbance in the Gulf of Mexico southwest of Sally that ulimately became Tropical Storm Beta. That's seven systems in one picture!


There are several factors that contributed to such an active hurricane season. As predicted in pre-season outlooks, a significant La Niña event developed during the summer, shown by the above graphs of sea surface temperature anomalies in different areas of the equatorial Pacific. These relatively cool temperatures are correlated with increased hurricane activity on the other side of the Americas, and this was certainly the case in 2020. A subtler, longer-term cycle also may have contributed to a record season: the Atlantic Multi-Decadal Oscillation (AMO) maintained its positive phase. This index is computed from Atlantic sea-surface temperatures, which were warm even relative to an overall warming planet. This in turn led to a stronger African monsoon and increased rainfall across the tropical Atlantic. As the name suggests, the AMO varies only slowly over dozens of years. Indeed, the five seasons 2016-2020 were all above average.


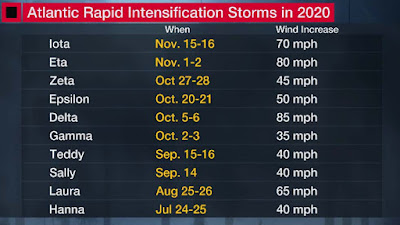
2020 also saw many, many instances of rapid intensification, as shown in the table above. Ten cyclones satisfied the technical criteria for rapid intensification, namely a 25 kt (30 mph) increase of maximum winds in a span of 24 hours. This tied the record set in 1995. Even more incredible were the top bouts of strengthening on the list: Delta, Eta, and Iota all gained at least 60 knots (70 mph) in 24 hours, which had only been observed a handful of times previously. This points to a final noteworthy aspect of 2020's activity: the absurdly ideal conditions in the western Caribbean sea during October and November. Record low vertical wind shear and high oceanic heat content extending well below the surface led to three of the season's seven major hurricanes developing there in those two months, as well as five of the ten intensfication episodes listed above. Tragically, these favorable conditions led to the season's worst impacts in Nicaragua and Honduras, which experienced a never before seen two consecutive category 4 landfalls in one week (Eta and Iota).


The above graphic (click to enlarge) illuminates yet another metric by which 2020 exceeded all previously known seasons: continental United States landfalls. A record twelve tropical storms and six hurricanes (the latter tying a record) hit the United States, putting the entire Gulf and east caosts under cyclone-related watches and warnings at some point during the year. The epicenter of this barrage was Lousiana, which had five landfalls, three of which were hurricanes and two major hurricanes. The strongest was the devastating Laura, which had the highest winds of a known landfalling Louisiana hurricane since 1856. Even so, the impact of these storms wasn't as great as it could have been, since relatively sparsely populated areas were affected.

Some other notable facts or records from the 2020 Atlantic hurricane season include:
  • Tropical Storm Arthur was a pre-season tropical cyclone that formed on May 14, marking the record sixth consecutive season in which a storm formed before the official start of the season on June 1
  • When Tropical Storm Bertha formed on May 27, it was the first time since 2012 that there were multiple pre-season storms
  • Hurricane Paulette first became a depression on September 6, and transitioned into a remnant low for the last time on September 19; in this interval, a remarkable seven named storms formed in the Atlantic: Rene, Sally, Teddy, Vicky, Beta, Wilfred, and Alpha
  • The diameter of tropical storm force winds of Hurricane Teddy just before its extratropical transition was 850 miles, breaking the top 5 for Atlantic hurricanes at the time
  • Subtropical Storm Alpha became the easternmost-forming Atlantic named storm on record when it formed near Portugal on September 18; that same day, it became the first named storm to make landfall in that country
  • Tropical Storm Theta traversed the farthest east of any November Atlantic tropical cyclone on record, ending up east of 20° W before dissipating.
The 2020 Atlantic hurricane season was the busiest on record in a number of categories, featuring a great number of deadly and destructive cyclones.

Friday, November 13, 2020

Hurricane Iota (2020)

Storm Active: November 13-18

On November 8, a tropical wave entered the Caribbean sea. It was producing disorganized thunderstorms throughout the Leeward Islands and Puerto Rico. It moved southwestward over the following days into a more favorable upper-level environment and the disturbance began to organize. On November 13, it was organized enough to be designated Tropical Depression Thirty-One. The depression's circulation was large, with an evident spin on satellite imagery and a convective band extending south and west. Later in the afternoon, the storm was upgraded to Tropical Storm Iota, the record-breaking thirtieth named storm of the 2020 season, and the first ever use of the name "Iota".

When it was first named, Iota was rather disorganized; the mid-level center was well southeast of the low-level center, while the latte was intermittently exposed. This was possibly due to lingering westerly shear, but this was quickly declining. Nevertheless, the storm took about a day to get fully stacked and its winds only increased a bit in the meantime. Though a ridge was gently steering Iota, it didn't move a ton on November 14. In fact, it moved south-southwestward for a time and the vigorous bands south of the center were low enough in latitude to impact northwestern Colombia. That evening, an inner core developed and rapid intensification began.

Overnight, Iota became a hurricane. It underwent an interesting structural shift the morning of the 15th, when an eyewall replacement cycle seemed to take place, even before an eyewall had completely formed. This left the storm with weaker winds and convection temporarily but a higher radius of maximum winds. Meanwhile, the central pressure continued to drop steadily, indicating that the changes were internal and that Iota was still strengthening. The cyclone also assumed a steadier course just north of west that it would maintain through landfall.

An eye appeared intermittently on satellite imagery during that day and the hurricane attained category 2 that evening. Then, an enormous burst of intensification ensued overnight, only the latest of a string of such episodes in the extraordinary 2020 season. During this period, Iota's pressure dropped 26 mb in a single six-hour period, along with a 10 mb drop in a single hour as recorded by reconaissance aircraft. In just 12 hours, the storm went from a 105 mph, 960 mb category 2 hurricane to its peak intensity as a 155 mph, 917 mb category 5 hurricane by the morning of November 16*. This made Iota the strongest storm of the 2020 season, surpassing Eta from a few weeks earlier. On top of this, 2020 became the first hurricane season ever with two major hurricanes in November.

*Note: Iota was operationally classified to have peaked as a category 5 hurricane with maximum winds of 160 mph; however, post-season analysis indicated that the surface wind estimates from aircraft reconnaissance may have been a bit too high, prompting a lowering of estimated peak winds to 155 mph. Though a minor change, this means Iota is no longer considered to have attained category 5 intensity.

Iota maintained top-end category 4 status for some of the day, but underwent another eyewall replacement cycle during the afternoon, which weakened it a bit before landfall. Nevertheless, the cyclone was an extremely intense hurricane when it made landfall in Nicaragua that evening. Tragically, its landfall point was less than 100 miles from Eta's, which had hit only a few weeks earlier. After landfall, Iota quickly weakened as it traversed increasingly mountainous terrain. Some high elevation areas of Nicaragua and Honduras recorded over 20 inches of rain during the storm's passage. It lost hurricane status around midday local time on November 17. The degradation of the circulation was relatively slow for a cyclone over land, though, and the center was still quite evident on satellite imagery as Iota passed inland into southern Honduras that evening.

The storm weakened to a tropical depression early on November 18, crossing into El Salvador, and dissipated a few hours later somewhere near the Pacific coastline. Even though the remnants of Iota moved back over water in the eastern Pacific, conditions there did not favor development.


The above image shows Hurricane Iota at category 4 intensity on November 16.


The conditions in the western Caribbean were extremely favorable for hurricane developement in October and November 2020. Iota formed in this same area and was the second category 4 landfall in two weeks in Nicaragua.

Monday, November 9, 2020

Tropical Storm Theta (2020)

Storm Active: November 9-15

A frontal boundary stretching across the subtropical Atlantic during the first week of November decayed, leaving a trough of low pressure and unsettled weather in its wake. Around November 7, a non-tropical low formed in association with the system well southeast of Bermuda. The low was generating significant convection in the form of a curved frontal band extending north and east of the center of circulation. Eventually, the low became separated from the band, but was still located within a broad upper-level low. The system also was generated gale force winds, so it was designated Subtropical Storm Theta. This designation of a 29th named storm officially broke 2005's record for the most ever recorded in an Atlantic hurricane season. It was the first ever use of "Theta" as well.

The storm was moving just north of east at a moderate pace. Sea surface temperatures were not especially warm, but a great deal of instability was present in the atmosphere to fuel Theta. Satellite estimates indicated that it strengthened over the following day to near hurricane strength. During the afternoon on November 10, Theta transitioned into fully tropical storm. The cyclone was dealing with wind shear near 50 knots, which would ordinarily overwhelm a tropical cyclone, but things are often different for late-season storms in the subtropics: one factor keeping Theta going was very cold air in the upper atmosphere. This meant that, despite cooler ocean temperatures, the altitude/temperature gradient was quite pronounced and supported deep convection.

After a little weakening overnight, Theta regained a bit of strength on November 11 when shear abated a tad. It was still riding the north edge of a mid-level ridge eastward with a very consistent forward speed. By November 13, ocean temperatures had dropped even further, and wind shear was bringing stable air out of the north. Theta started to weaken, slow down, and turn south of east. Enough convection persisted on the southeastern edge of the cyclone for it to stay tropical through the next day. It also was the first Atlantic tropical storm on record to travel so far east in November, past 20° W. Unfavorable conditions eventually overcame Theta though. It weakened to a tropical depression overnight and to a remnant low the next morning just norhwest of the Canary Islands.


The above image shows Theta as a subtropical storm on November 10.


Theta did not have any land impacts along its journey across the eastern Atlantic.