Storm Active: July 14-24
On July 11, an area of low pressure formed east-northeast of Bermuda. The system moved slowly eastward over the next few days and deepened a bit, though the Atlantic waters at that latitude were only lukewarm and atmospheric conditions weren't ideal for development. At first, thunderstorm activity was disorganized and displaced southeast of the vorticity center, but a curved banding structure emerged by July 13, wrapping more tightly around the low-pressure center. The storm began to produce gale force winds as well. At that point, the low was still elongated and extratropical in apperance. On July 14, however, it became better defined and the system was classified Subtropical Storm Don. The subtropical classification was due to the broad and diffuse convective structure and its interaction with an upper-level trough nearby.
Don was named with 50 mph winds and actually weakened slightly during the following day. The center was meandering a great deal, but the storm generally moved northward through July 15. There was a ridge of high pressure steering Don from the west, and the storm began a slow clockwise loop around it as the ridge pressed eastward over the following days. Ocean temperatures under the system became yet colder and could not be totally offset by colder-than-usual upper-atmospheric temperatures. As a result, Don weakened to a subtropical depression on July 16. On July 17, the storm was reclassified as a tropical depression after separating from the upper-level trough.
Don strengthened into a tropical storm overnight but still looked unimpressive on satellite imagery. Around midday on the 18th, Don was halfway through its large loop and was moving south, which returned it to a more conducive environment with warmer seas and lower shear. Soon after that, the storm finally developed some consistent deep convection over the center. This allowed it to begin some modest intensification. It turned west, then northwest over the next couple of days. Around July 20, Don developed an eyelike feature at the center of its very small central dense overcast. The storm was so small that it struggled to mix the dry air out of the very compact circulation. However, it got a boost on July 22 from passing over the slightly warmer waters of the Gulf Stream and vaulted to hurricane strength, becoming the first hurricane of the 2023 Atlantic hurricane season.
Hurricane Don peaked with winds of 75 mph and a minimum pressure of 988 mb late on the 22nd. Overnight, the storm moved north of the Gulf Stream and sea surface temperatures underneath it began to plunge. The system was recurved toward the northeast and soon weakened to a tropical storm. It lost the last of its deep convection by early on July 24 and became post-tropical shortly after that. The remnants dissipated another day or so later.
The above image shows Don as a hurricane on July 22. The cyclone had an impressive but small core, and became a hurricane at a fairly high latitude.
Don was a long-lived storm by July standards; it lingered around the subtropical Atlantic over 10 days and became at the time the fifth longest-lasting July storm (including time both as a tropical and a subtropical cyclone). Subtropical points are squares in the above track, while tropical points are circles. Triangles denote points where the system was not yet named or post-tropical, and are not counted toward its longevity. Despite its long life, Don never affected any land areas.
Saturday, July 15, 2023
Thursday, June 22, 2023
Tropical Storm Cindy (2023)
Storm Active: June 22-25
Around June 17, a new tropical wave showed signs of development in the eastern Atlantic. Though thunderstorm activity was limited at first, it blossomed on June 20 when persistent convection covered the nascent circulation. Finally, early on June 22, the small system was organized enough to be designated Tropical Depression Four.
Initially, the center of circulation was on the eastern edge of the convective canopy, but the storm gradually became better organized throughout the day and was ultimately named Tropical Storm Cindy that evening. The previously formed Tropical Storm Bret and Cindy both formed in the tropical Atlantic east of the Caribbean sea during the month of June, the first time on record two storms had been named in that region during hurricane season's first month. It was also the first instance of simultaneous June named storms since 1968. The extremely warm waters in the vicinity were the main cause of that event.
Cindy was moving west-northwest steadily under the influence of the subtropical ridge, which had retreated northward a bit after keeping Bret on a more westward trek into the Caribbean. The storm intensified on June 23, though in fits and starts: it developed a banding structure in the early morning only for most convection to collapse in the afternoon and then return with a venegeance in the evening. The net result was that Cindy reached a peak of 60 mph winds before increasing shear began to expose the center of circulation again, this time on the northwest side of the thunderstorm activity.
Cindy turned toward the northwest and passed well northeast of the Lesser Antilles on June 24. The wind shear affecting the cyclone shifted to come from the southwest and increased even more. The storm's structure did not long survive this onslaught and Cindy dissipated late on June 25.
The image above shows Cindy northeast of the Lesser Antilles.
Cindy reached an area of high shear after passing 60 °W and dissipated not long after that.
Labels:
2023 Storms
Monday, June 19, 2023
Tropical Storm Bret (2023)
Storm Active: June 19-24
On June 15, a vigorous tropical wave moved over the eastern tropical Atlantic from mainland Africa. It was the first tropical wave of the 2023 season to show signs of development upon entering the basin, and marked a rather early start to the Cabo Verde hurricane season. The system moved quickly westward and steadily organized. By the 18th, there was rotation evident in the satellite signature; the next day, Tropical Depression Three formed.
Shortly afterward, the depression strenghtened into Tropical Storm Bret. Ocean temperatures and atmospheric humidity both favored further intensification, but its fast motion and some mid-level westerly shear made it more difficult for it to build a central core. Nonetheless, the storm's maximum winds increased steadily on June 20. Bret reached its peak intensity of 70 mph winds and a central pressure of 996 mb very early on June 22. It was near hurricane strength, but was rather lopsided and didn't have much spiral banding on satellite.
Later that morning, increasing wind shear caught up with the cyclone as the center of circulation began to outrun the convection to the west. The storm began to weaken but passed among the Leeward Islands that night still as a strong tropical storm, bringing strong winds to the islands. Bret picked up more speed toward the west as it traversed the eastern Caribbean on June 23. Even after the center had moved a few hundred miles to the west, the storm generated heavy rains over the Leeward Islands from all the moisture that the wind shear had displaced eastward.
Bret's center steadily degraded over the following day and it weakened. The storm took a fast southern route through the Caribbean and passed barely north of the Venezuelan coastline during the morning of June 24. Later that day, the circulation opened up and Bret dissipated north of Colombia. Some of the storm's remnants ultimately contributed to the formation of Hurricane Beatriz in the Eastern Pacific a few days later.
The image above shows Bret near peak intensity in the open tropical Atlantic. Though Bret neared hurricane strength, it never acquired the typical central dense overcast typical of a storm of that caliber.
As with many tropical storms with similar track before it, Bret ultimately succumbed to the hurricane graveyard of the eastern Caribbean.
Labels:
2023 Storms
Friday, June 2, 2023
Tropical Storm Arlene (2023)
Storm Active: June 1-3
Near the end of May, an area of thunderstorms formed in association with a trough over the Gulf of Mexico. A circulation gradually developed as it drifted northward. On the first official day of the Atlantic hurricane season, June 1, the low was classified Tropical Depression Two. It was given the "Two" designation because of the unnamed subtropical storm that had formed in January 2023. When it first formed, the depression was colocated with an upper-level trough; this gave it a pocket of mildly favorable conditions for intensification. It took advantage and strengthened into Tropical Storm Arlene on June 2, becoming the first named storm of the season.
Atmospheric conditions quickly soured after that, however. The aforementioned trough pushed eastward, exposing the cyclone to wind shear and encroaching dry air from the west. Though the storm formed with the Gulf coast nearby to the north and east, it actually picked up steam toward the south and moved away from land, following the flow of the trough. By later that day, it began to weaken. Early on June 3, it turned east of south and diminished into a tropical depression; it became a remnant low just hours later in the southern Gulf of Mexico adjacent to Cuba.
Arlene peaked as a weak tropical storm before being quickly snuffed out by dry air and unfavorable wind shear.
Arlene's southward track was somewhat unusual; it did not affect land during its brief lifetime.
Labels:
2023 Storms
Saturday, May 27, 2023
Professor Quibb's Picks – 2023
My personal prediction for the 2023 North Atlantic Hurricane season (written May 27, 2023) is as follows:
15 cyclones attaining tropical depression status,
14 cyclones attaining tropical storm status,
8 cyclones attaining hurricane status,
4 cyclones attaining major hurricane status.
This prediction is near the 1991-2020 averages of 14.4 tropical storms, 7.2 hurricanes, and 3.2 major hurricanes each season in the Atlantic basin. I expect that 2023 will thus be an about average season. Below, I'll discuss the various factors involved in making this prediction. Note that the the NOAA identified a unnamed subtropical storm that formed in January 2023 in the western subtropical Atlantic, which was not designated operationally at the time. This storm is included in the above total, and will be covered on this blog once a tropical cyclone report on it is released.
I'll begin as usual with the El Niño Southern Oscillation (ENSO) index. Though simply a measure of sea surface temperature anomalies in the equitorial Pacific Ocean, it is correlated with trends in tropical cyclone activity all around the globe. For the Atlantic specifically, warmer than normal Pacific waters (El Niño) tend to give quieter Atlantic seasons, while cooler than normal waters (La Niña) lead to busier Atlantic seasons. It's worth noting that our understanding of this phenomenon, as well as possibly the ENSO cycle itself, has changed over the last few decades. Indeed, even as oceans have drastically warmed overall over the past 40 years due to anthropogenic climate change, the equatorial Pacific has actually slightly cooled; relative to average, La Niña events have been much more frequent and intense recently than El Niño ones (read more here). For instance, La Niña conditions dominated for almost three years from 2020-2023. It's not certain exactly how or why this is occurring. Nevertheless, in 2023 specifically, things are changing. A rapid warming is underway in the Pacific, and it's widely expected that an El Niño will begin soon, becoming moderate to strong by the latter half of hurricane season. This should have a significant suppressing effect on Atlantic tropical cyclone activity come summer.
Nevertheless, there are some signs that point in the opposite direction.
Moving from the Pacific to the Atlantic, we also see above average sea surface temperatures in the main cyclone formation regions, including the tropical Atlantic, the Caribbean, and the Gulf of Mexico. The effect of these anomalies on hurricane formation is more straightforward: warmer oceans mean more favorable conditions for development and intensification. It's worth noting that some of the warmest areas are in the tropics rather than the subtropics this year, where they will likely give a greater boost to tropical cyclones. The best recent historical analog for this sea surface temperature profile in May is 2010, a very active hurricane season.
One last major factor to examine is wind shear. The figure below, from Colorado State University's annual hurricane forecast report, shows different possible atmospheric wind profiles and how they might influence Atlantic hurricane activity.
The graphic above shows two possible scenarios for wind shear across the MDR (Main Development Region) of the Atlantic. The vertical direction indicates height in the atmosphere, and the horizontal axis is the component of the wind speed in the west-east direction (left is west, right is east) averaged across the indicated area. At lower altitudes, the east-to-west trade winds dominate the scene, but the wind direction may often change several miles aloft. The change of west-east wind speed with height is known as zonal wind shear and has significant implications for cyclone activity. In the unfavorable (blue) profile, the surface trade winds are stronger but the winds switch east near the top of the troposphere, the layer of Earth's atmosphere where most weather occurs. This makes it difficult for vertically aligned vortices to form, because different levels of a nascent circulation are pushed in opposite directions.
The red profile, in contrast, is a relatively uniform westerly wind at every level, meaning wind shear is low and conditions are favorable for tropical cyclone development. CSU takes spring zonal wind shear measurements into account when making their forecast; this shear has been a bit lower than normal for 2023 so far. Of course, this could change: El Niño also sometimes brings about a high zonal shear regime across the Atlantic. Putting all this together, I'm forecasting a near average hurricane season. I'll give a finer analysis of the risks by region. My estimates are on a scale from 1 (least risk) to 5 (most risk).
U.S. East Coast: 2
I'll put the east coast at lower than usual risk this year. The subtropical Atlantic has consistently been dominated by troughs this year so far, so cyclones reaching the latitude of the east coast have a good chance of recurving to the east. The oncoming El Niño may bring an early fall to the continental U.S., shutting down development in this region by October.
Yucatan Peninsula and Central America: 3
A more active Pacific hurricane season could help suppress cyclone formation on the other side of central America this summer. However, Atlantic waters are particularly warm in the southwestern Caribbean, which is always a danger zone for rapid intensification. I expect most of the season to be quiet in this region, but the possibility of a few strong storms brings the risk up to a 3.
Carribean Islands: 4
El Niño aside, the tropical Atlantic looks as favorable as it has looked in a while: temperatures are very warm, and the Saharan air layer is less prominent than usual near Africa. Look for possible long-track hurricanes forming and affecting the Caribbean islands, before likely turning northward. I'll put the eastern islands at greater risk than the western ones.
Gulf of Mexico: 2
The same factors at play for the U.S. East Coast give a similar story here. Though waters are warm, I think shear and atmospheric steering currents should shield the Gulf coast from the worst impacts, particularly during the latter half of the season. July and August may be the riskiest months for a Gulf hurricane landfall if one does occur.
Overall, I expect the 2023 Atlantic hurricane season to be around average, with perhaps a slightly larger number of hurricanes and major hurricanes than usual (though I expect most of these to go out to sea). Nevertheless, this is just an amateur forecast. Individuals in hurricane-prone areas should always have emergency measures in place. For more on hurricane safety sources, see here. Remember, devastating storms can occur even in otherwise quiet seasons.
Sources: https://yaleclimateconnections.org/2023/04/a-mystery-in-the-pacific-is-complicating-climate-projections/, https://www.nhc.noaa.gov/sst/rsst_atl_anom_loop.php, https://tropical.colostate.edu/forecasting.html
Labels:
Hurricane Stats
Thursday, May 25, 2023
Hurricane Names List – 2023
The name list for tropical cyclones forming in the North Atlantic basin for the year 2023 is as follows:
Arlene
Bret
Cindy
Don
Emily
Franklin
Gert
Harold
Idalia
Jose
Katia
Lee
Margot
Nigel
Ophelia
Philippe
Rina
Sean
Tammy
Vince
Whitney
This list is the same as that for the 2017 season, with the exception of Harold, Idalia, Margot, and Nigel, which replaced the retired names Harvey, Irma, Maria, and Nate, respectively.
Labels:
Hurricane Stats
Sunday, December 18, 2022
2022 Season Summary
The 2022 Atlantic hurricane season was close to average in overall activity, with a total of
16 cyclones attaining tropical depression status,
14 cyclones attaining tropical storm status,
8 cyclones attaining hurricane status, and
2 cyclones attaining major hurricane status.
Before the beginning of the season, I predicted that there would be
20 cyclones attaining tropical depression status,
19 cyclones attaining tropical storm status,
9 cyclones attaining hurricane status, and
5 cyclones attaining major hurricane status.
The average numbers of tropical storms, hurricanes and major hurricanes (over the 30 year period 1991-2020) were 14.4, 7.2, and 3.2, respectively. The eventual numbers for 2022 were quite close to this average, though with realtively few major hurricanes. The (preliminary) Accumulated Cyclone Energy value for the 2022 season was 95, a little below average but well-within "near normal" range. This measure of activity accounts both for strength and duration of tropical cyclones. The exact value sometimes shifts when post-season analysis is complete. This year, my predictions were significantly above the outcome, except in the hurricanes category where it was fairly close. Other official forecasts, such as those by the NOAA and by Colorado State University, were similarly above the mark. So what happened? As predicted before the season, La Niña conditions prevailed throughout the summer and fall. This meant that equatorial Pacific sea surface temperatures were below normal, as the above diagram indicates for different zones. Such a strong La Niña would usually correlate to increased Atlantic activity, and was a major factor in pre-season forecasts. Atlantic ocean temperatures in hurricane formation zones also ran above normal, so we'll have to look elsewhere for an explanation of the underperformance.
Of particular note is the fact that no tropical cyclones formed during the month of August. This was the first time this had occurred since 1997, and the first time ever that this was observed to happen during a La Niña, dating back to the mid-20th century when detailed observations of the El Niño cycle began. Further, the only storms which formed prior to August were three short-lived tropical storms. The first hurricane was Danielle, which reached hurricane status on September 3, becoming the latest first hurricane in the Atlantic since 2013. In contrast, September through November was an unusually busy period, more consistent with climatological patterns. The main culprits for the August quiet period were elevated wind shear and dry air. The map above charts the cumulative anomalies in relative humidity in the mid-levels of the atmosphere over the period August 1-22, 2022, vs. 30-year averages. The main development region in the tropical Atlantic east of the Caribbean was the epicenter of a dry air spell which lasted most of the month. Saharan dust was a major contributor to the dry air event. It prevented tropical waves from developing convective activity, which in turn would allow them to build vorticity, gain latitude, and detach from the Intertropical Convergence Zone (ITCZ). When tropical waves reached the Caribbean, another obstacle awaited them.
The first three weeks of August also saw well above average wind shear in the Caribbean sea. Wind shear measures the difference in winds at different heights in the atmosphere; a greater difference in winds prevents atmospheric vortices from the low and mid-levels aligning vertically, or "stacking". This is a necessary ingredient for tropical cyclones to form and strengthen. In comparison to my pre-season prediction, this wind shear event was especially surprising, since I had cited models which indicated wind shear would be below average for the June-July-August period. It's not clear why the model forecast was poor, but the immediate sources of the shear were systems called tropical upper-trospheric troughs (TUTTs). These are large areas of low pressure in the higher levels of the atmosphere, in this case usually located over the central Atlantic northeast of the Caribbean. These features generate counterclockwise flow, which runs opposite to the low-level east-to-west trade winds in the tropics. This combination amounts to high wind shear.
In my region-by-region predictions, I put all sectors of the Atlantic basin at higher-than-normal risk, but had only the Gulf of Mexico at highest risk. Unfortunately, this part of the forecast verified. The strongest winds and largest impacts of 2022 came from Hurricane Ian, which made landfall along the Florida Gulf coast as a top-end category 4 hurricane. Elswhere, Hurricane Fiona was the most impactful; it primarily affected Purto Rico and neighoring islands, as well as Atlantic Canada.
Some other notable facts or records from 2022 include:
Sources: https://www.cpc.ncep.noaa.gov/products/analysis_monitoring/lanina/enso_evolution-status-fcsts-web.pdf, https://yaleclimateconnections.org/2022/08/quiet-in-the-atlantic-will-we-go-0-for-august/
16 cyclones attaining tropical depression status,
14 cyclones attaining tropical storm status,
8 cyclones attaining hurricane status, and
2 cyclones attaining major hurricane status.
Before the beginning of the season, I predicted that there would be
20 cyclones attaining tropical depression status,
19 cyclones attaining tropical storm status,
9 cyclones attaining hurricane status, and
5 cyclones attaining major hurricane status.
The average numbers of tropical storms, hurricanes and major hurricanes (over the 30 year period 1991-2020) were 14.4, 7.2, and 3.2, respectively. The eventual numbers for 2022 were quite close to this average, though with realtively few major hurricanes. The (preliminary) Accumulated Cyclone Energy value for the 2022 season was 95, a little below average but well-within "near normal" range. This measure of activity accounts both for strength and duration of tropical cyclones. The exact value sometimes shifts when post-season analysis is complete. This year, my predictions were significantly above the outcome, except in the hurricanes category where it was fairly close. Other official forecasts, such as those by the NOAA and by Colorado State University, were similarly above the mark. So what happened? As predicted before the season, La Niña conditions prevailed throughout the summer and fall. This meant that equatorial Pacific sea surface temperatures were below normal, as the above diagram indicates for different zones. Such a strong La Niña would usually correlate to increased Atlantic activity, and was a major factor in pre-season forecasts. Atlantic ocean temperatures in hurricane formation zones also ran above normal, so we'll have to look elsewhere for an explanation of the underperformance.
Of particular note is the fact that no tropical cyclones formed during the month of August. This was the first time this had occurred since 1997, and the first time ever that this was observed to happen during a La Niña, dating back to the mid-20th century when detailed observations of the El Niño cycle began. Further, the only storms which formed prior to August were three short-lived tropical storms. The first hurricane was Danielle, which reached hurricane status on September 3, becoming the latest first hurricane in the Atlantic since 2013. In contrast, September through November was an unusually busy period, more consistent with climatological patterns. The main culprits for the August quiet period were elevated wind shear and dry air. The map above charts the cumulative anomalies in relative humidity in the mid-levels of the atmosphere over the period August 1-22, 2022, vs. 30-year averages. The main development region in the tropical Atlantic east of the Caribbean was the epicenter of a dry air spell which lasted most of the month. Saharan dust was a major contributor to the dry air event. It prevented tropical waves from developing convective activity, which in turn would allow them to build vorticity, gain latitude, and detach from the Intertropical Convergence Zone (ITCZ). When tropical waves reached the Caribbean, another obstacle awaited them.
The first three weeks of August also saw well above average wind shear in the Caribbean sea. Wind shear measures the difference in winds at different heights in the atmosphere; a greater difference in winds prevents atmospheric vortices from the low and mid-levels aligning vertically, or "stacking". This is a necessary ingredient for tropical cyclones to form and strengthen. In comparison to my pre-season prediction, this wind shear event was especially surprising, since I had cited models which indicated wind shear would be below average for the June-July-August period. It's not clear why the model forecast was poor, but the immediate sources of the shear were systems called tropical upper-trospheric troughs (TUTTs). These are large areas of low pressure in the higher levels of the atmosphere, in this case usually located over the central Atlantic northeast of the Caribbean. These features generate counterclockwise flow, which runs opposite to the low-level east-to-west trade winds in the tropics. This combination amounts to high wind shear.
In my region-by-region predictions, I put all sectors of the Atlantic basin at higher-than-normal risk, but had only the Gulf of Mexico at highest risk. Unfortunately, this part of the forecast verified. The strongest winds and largest impacts of 2022 came from Hurricane Ian, which made landfall along the Florida Gulf coast as a top-end category 4 hurricane. Elswhere, Hurricane Fiona was the most impactful; it primarily affected Purto Rico and neighoring islands, as well as Atlantic Canada.
Some other notable facts or records from 2022 include:
- The 2022 season ended a streak of six consecutive seasons in which a tropical cyclone had formed prior to June 1
- Tropical Storm Bonnie and Hurricane Julia both crossed from the Atlantic to the Pacific basins and retained their names; this was the first time this had happened twice on record
- When Fiona made landfall as an extratropical cyclone in Nova Scotia, it broke the record for lowest barometric pressure ever reported in Canada; the new record was 931.6 mb
- Martin and Nicole were hurricanes simultaneously, which was the third time this had occurred in November, after 1932 and 2001
- Nicole was the first Florida hurricane landfall in November since Hurricane Kate in 1985
Sources: https://www.cpc.ncep.noaa.gov/products/analysis_monitoring/lanina/enso_evolution-status-fcsts-web.pdf, https://yaleclimateconnections.org/2022/08/quiet-in-the-atlantic-will-we-go-0-for-august/
Labels:
Hurricane Stats
Monday, November 7, 2022
Hurricane Nicole (2022)
Storm Active: November 7-11
Around November 5, a huge area of disturbed weather developed across the eastern Caribbean and neighboring areas of the Atlantic. The system was broad and disorganized, but brought several inches of rain to Puerto Rico and Hispaniola as the strongest storms passed northward through that area over the following day. A low pressure center appeared on November 6 northwest of Puerto Rico, but it was non-tropical in nature at first. This slowly changed as scattered convection developed near the center, and the system was designated Subtropical Storm Nicole early on November 7.
At first, the cyclone moved gradually northwest, but a ridge began to build north of Nicole, turning it toward the west the next day. Meanwhile, despite periodic intrusions of dry air into the center, the storm strengthened steadily. The pressure gradient between the system and the ridge drove some intense winds north of the center; as a result, Nicole had a very large radius of gale force winds, even as the core tightened. The cyclone transitioned to a fully tropical storm on November 8. It actually turned south of west that night and approached hurricane strength as it neared the Bahamas. The storm owed its continued intensification to anomalously warm waters in the western Atlantic; these waters allowed it to reach category 1 hurricane status on November 9. By then, Nicole was close to landfall in eastern Florida. The system didn't look much like a typical hurricane, as it lacked a traditional central dense overcast, but this didn't stop it from bringing strong winds and heavy rain to much of the Florida peninsula.
The center officially moved ashore very early on November 10. In doing so, it became just the third hurricane on record to make landfall in Florida in November, and the first since Hurricane Kate in 1985. Soon after, it weakened to a tropical storm. The ridge to the storm's north moved out toward the east, allowing Nicole to begin a northward turn. It nevertheless emerged briefly over the Gulf of Mexico. It stayed very close to the west coast of Florida though, and soon moved ashore again along the Gulf coast. An approaching front picked up Nicole at that point and began to accelerate it toward the northeast. The storm weakened to a tropical depression that night, and became post-tropical over the southeast U.S. on November 11. It brought a quick hit of flooding rains to regions all along the Appalachians over the next day or so.
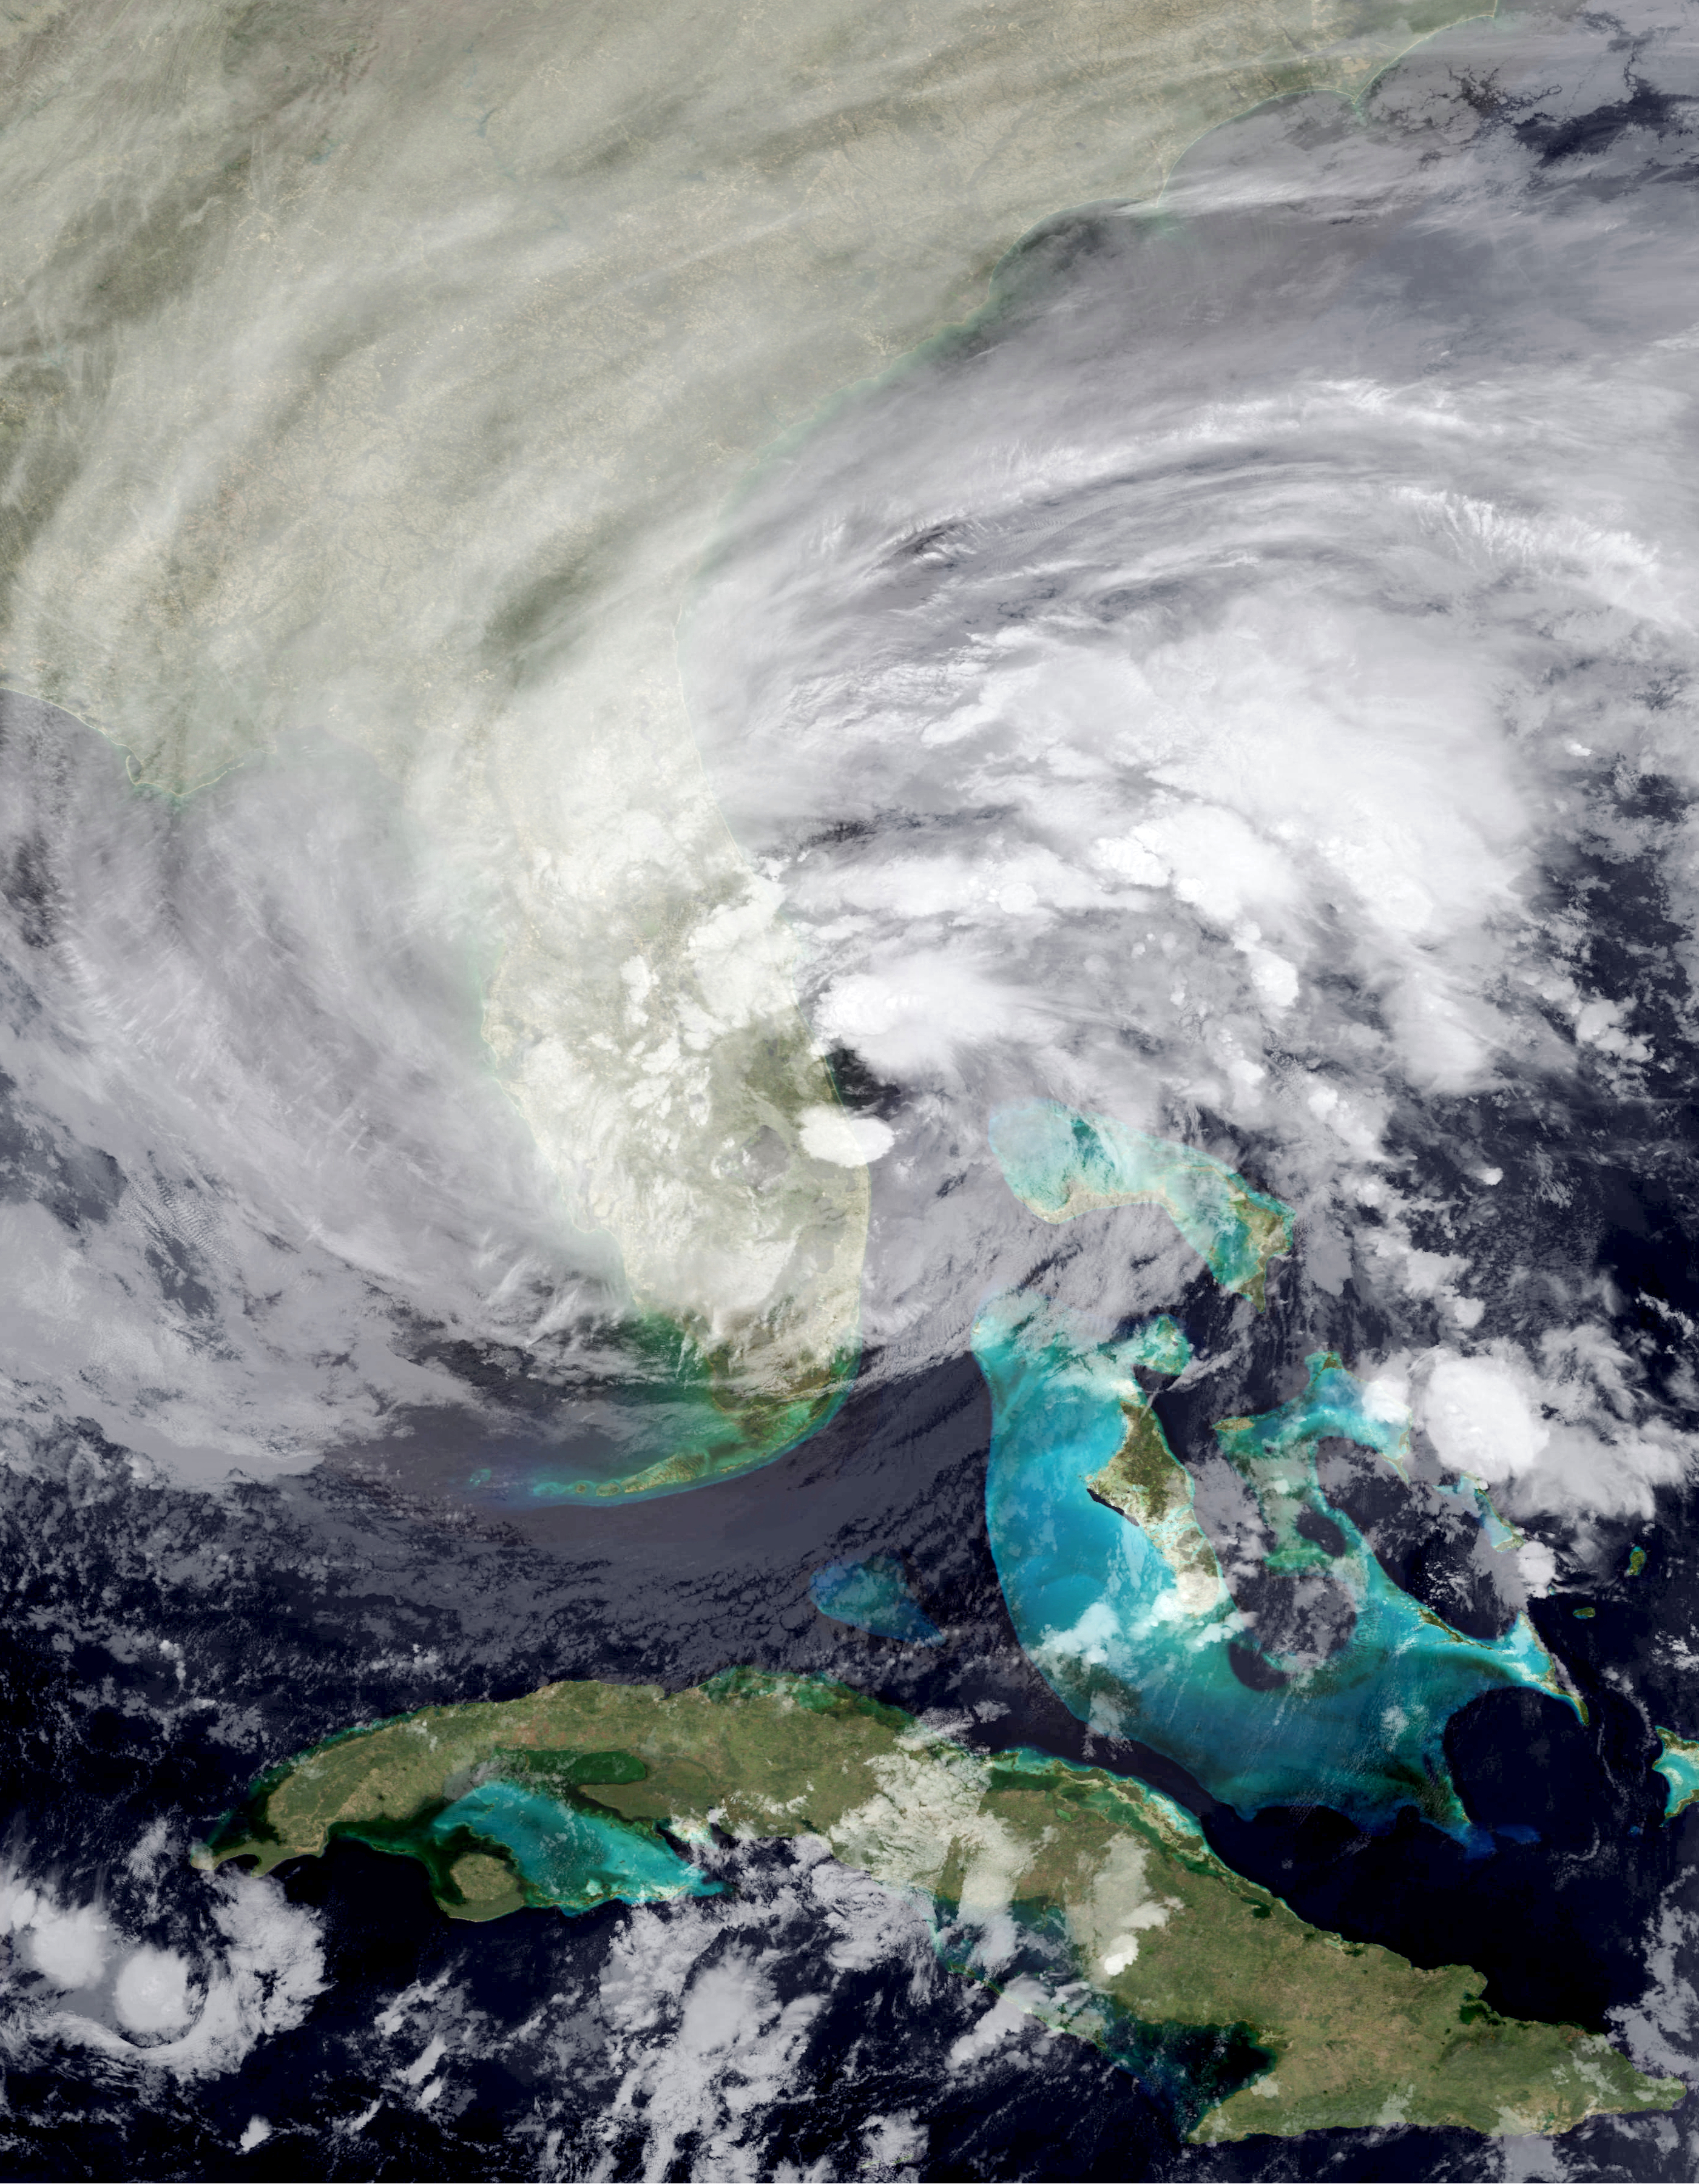
Nicole was an unusual hurricane on satellite imagery, with little convection near the center. The above image shows it at landfall on November 10.
Both Nicole's formation point and its westward track were rare for a November cyclone, allowing it to join a small handful of U.S. landfalling hurricanes in the month.
Labels:
2022 Storms
Wednesday, November 2, 2022
Hurricane Martin (2022)
Storm Active: November 1-3
On October 25, a trough of low pressure formed in the western Atlantic, extending from near the central Caribbean islands to near the U.S. East coast. The system was producing a large area of disorganized thunderstorm activity. A low formed along the trough around October 28, but it was non-tropical in nature. The system flirted with tropical status, but didn't quite have enough convective activity to be classified a tropical cyclone. The low passed near Bermuda on October 30, but strong upper-level winds prevented further development. After moving further northeastward, the system found a pocket of favorable conditions and began to strengthen and develop a warm core. On November 1, it became Tropical Storm Martin around 550 miles east-northeast of Bermuda.
The storm had a curved-band appearance on satellite imagery, with most convection extending west and north of the center. Sea surface temperatures weren't particularly warm, but a cold upper atmosphere generated enough temperature gradient for plentiful instability. In addition, a favorable jet interaction helped to drive intensification in Martin. On November 2, the storm accelerated northeastward as it felt the mid-latitude southwesterly flow, and developed a small eye on satellite imagery; as a result, Martin was upgraded to a hurricane that day. Since Martin and Lisa were hurricanes simultaneously, this became the third time in recorded history that two Atlantic hurricanes coexisted in November, after 1932 and 2001.
The cyclone intensified further on November 3, reaching peak winds of 85 mph. However, it was also swiftly becoming extratropical, with the inner core becoming less defined, but the radius of gale force winds ballooning quickly outward as the low deepened. Martin's transition to an extratropical storm on November 3 was extreme in many ways in fact: by the time it became post-tropical, it was absolutely rocketing northeastward at almost 60 mph. Tropical storm force winds extended across a diameter of over 1000 miles, stretching across a majority of the Atlantic around 50 ° N latitude. Finally, though Martin achieved a minimum pressure of 960 mb as a tropical cyclone, it deepened to a low of 932 mb after transition.
After the low's peak in strength on November 4, it began to slowly wind down and move more slowly to the east. Ex-Martin ultimately dissipated northwest of Ireland a few more days after that.
The image above shows Martin after strengthening to a hurricane on November 2.
Martin did not directly affect any land areas, but became a potent extratropical storm with hurricane force winds over the far northern Atlantic.
Labels:
2022 Storms
Monday, October 31, 2022
Hurricane Lisa (2022)
Storm Active: October 31-November 5
During the last week of October, an area of disturbed weather formed in the southeastern Caribbean sea. It moved generally west-northwestward over the next few days, and upper-level winds gradually became more favorable for development. Around October 30, a broad low pressure center formed west of the main convective mass, with several small vortices rotating around a poorly-defined circulation. At that point, it was not yet organized enough to be declared a tropical cyclone. The next day, however, more significant thunderstorm activity popped up closer to the center swirl and the system was classified Tropical Storm Lisa.
At first, Lisa's circulation was not well-stacked, which slowed strengthening in the short term. The steering pattern near Lisa was quite simple: a ridge to its north kept it on a consistent west-northwest track over the next few days. On November 1, the storm passed just north of Honduras, but since it had a small circulation, impacts to that country were minor. By that time, Lisa's circulation had become better defined, but pockets of dry air prevented it from rapidly intensifying. Nevertheless, winds increased steadily, and Lisa ultimately became a hurricane early on November 2.
The hurricane strengthened right up to landfall, reaching a peak intensity of 85 mph winds and a central pressure of 990 mb before moving into Belize that afternoon, bringing strong winds and storm surge to a relatively small area of the coast. The cyclone remained intense, however, as it pushed inland. It was downgraded to a tropical storm that night and to a tropical depression on November 3. Lisa moved west-northwestward and emerged into the Bay of Campeche the next evening. The storm did get a boost in thunderstorm activity once it was back over water, but restrengthening was cut short on November 4 by a sharp increase in upper-level winds. The convection was quickly stripped away from the center of circulation, and Lisa meandered a little longer before dissipating on November 5.
The above image shows Lisa as a category 1 hurricane, right before landfall in Belize.
Lisa was a small cyclone and its effects were mainly felt very close to the forecast track in Belize and southeastern Mexico.
Labels:
2022 Storms
Subscribe to:
Posts (Atom)