Pages

Tuesday, December 22, 2015

2015 Season Summary

The 2015 Atlantic hurricane season had below-average activity, with a total of

12 cyclones attaining tropical depression status,
11 cyclones attaining tropical storm status,
4 cyclones attaining hurricane status, and
2 cyclones attaining major hurricane status.

Before the beginning of the season, I predicted that there would be

9 cyclones attaining tropical depression status,
7 cyclones attaining tropical storm status,
3 cyclones attaining hurricane status, and
1 cyclone attaining major hurricane status.

The season was in fact slightly below average, since the average numbers of tropical storms, hurricanes, and major hurricanes are 12.1, 6.4, and 2.7, respectively. However, the actual totals exceeded my predictions in all categories. Nonetheless, a majority of the cyclones that did form were short-lived, a fact which is quantitatively confirmed by the low value of the Accumulated Cyclone Energy. This value, which was 59 for the 2015 season, takes into account both the intensity and longevity of each storm. 59 is only 67% of the thirty year median and is lower than that of the 2014 season, though it featured a smaller number of cyclones.

The greatest influence on cyclone development of the 2015 season was the strong El Nino event. Indicated by anomalously warm ocean temperatures over the equatorial East Pacific region, this event began in 2014 but strengthened significantly through 2015, becoming one of the three strongest events in recorded history and at least the strongest since 1997-8. As a result, strong upper-level winds prevailed across the Caribbean sea and Gulf of Mexico (as well as other parts of the tropical Atlantic). Notably, no tropical storms formed in the Caribbean during the season, and the two that entered it, Danny and Erika, were torn apart by wind shear shortly after doing so.


In contrast, high sea surface temperatures supported tropical cyclone formation. The above map, showing global temperature anomalies during September 2015 (the heart of hurricane season) show a band of record warm ocean temperatures over the subtropics, extending from the Bahamas and southeastern U.S. coast eastward. This band supported the formation of Hurricane Joaquin toward the end of September and early October, which became the strongest storm of the season with 155 mph winds and a minimum pressure of 931 mb. Record sea temperatures fueled this system in spite of the El Nino; the comparable El Nino events of 1997, 1982, and 1972 had no hurricanes even close to this strength. The season included a few tropical storm landfalls in the United States, but Joaquin's impact on the Bahamas was by far the most devastating.

Some other notable facts and statistics concerning this season include:
  • Tropical Storm Ana made the second-earliest U.S. landfall in the Carolinas on May 10, behind only the unusual Groundhog Day storm of 1952
  • Hurricane Fred was named at 18.9° W, one of only 4 storms to be named this far east; it also was the first storm in a century to affect the Cape Verde Islands as a hurricane
  • Hurricane Joaquin was the strongest cyclone in the Atlantic basin since Igor of 2010


Overall, the season was quiet, with Joaquin as the only notable cyclone in terms of intensity and damage.

Sources: http://www.vox.com/2015/8/17/9164499/el-nino-2015, http://www.ncdc.noaa.gov/sotc/

Monday, November 9, 2015

Hurricane Kate (2015)

Storm Active: November 8-12

Kate originated from a trough of low pressure that moved across the tropical Atlantic during the first week of November. The system moved west-northwest across the northeastern Caribbean, passing near Puerto Rico on November 7. Early on November 8, a low pressure center appeared on the south end of the trough just north of Hispaniola and thunderstorm activity became better organized. The low became well-defined enough to be classified Tropical Depression Twelve late that evening. The next morning, the depression was upgraded to Tropical Storm Kate as deep convection increased near the center. At that time, the storm was moving northeast over the Bahamas, but its small size limited rainfall totals.

After the center briefly became exposed on the south side of the convective canopy, organization began to improve, with banding features appearing. Kate strengthened as it moved northward away from the Bahamas during the afternoon. The system meanwhile began to accelerate toward the north and eventually northeast on November 10. Despite diminishing sea surface temperatures, the storm continued to intensify through November 11, when it strengthened into a hurricane. Hurricane Kate reached its peak intensity of 75 mph winds and a pressure of 985 mb that morning, at which time it was already north of Bermuda, speeding toward the northeast at 40 mph. The cyclone was already showing signs of extratropical transition that afternoon as it moved over the cold northern Atlantic. By November 12, the circulation had become quite elongated and the remaining convection warm and asymmetric, so Kate was declared extratropical. The still powerful system continued north and east across the Atlantic before merging with another low a few days later.


The above image shows Kate at peak strength moving rapidly out to sea on November 11. The cyclone was already exhibiting some asymmetry and diminished central convection, two signs of extratropical transition.


Hurricane Kate affected the Bahamas as a tropical storm before recurving away from the United States coastline.

Monday, September 28, 2015

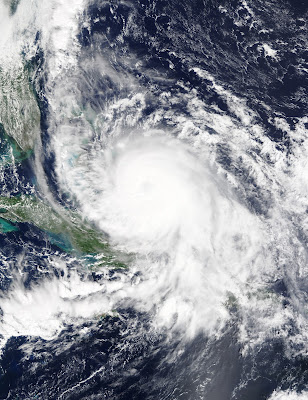
Hurricane Joaquin (2015)

Storm Active: September 27-October 8

On September 25, a trough of low pressure situated over the tropical western Atlantic began to exhibit some signs of organization as it moved slowly toward the north-northwest. The next day, a surface low formed in association with the system and thunderstorm activity became more concentrated. On September 27, the low deepened and became better defined. Persistent deep convection near the center of circulation therefore led to the designation of Tropical Depression Eleven late that evening.

Immediately after formation, Eleven already faced increasing shear out of the north-northwest that exposed the center of circulation. Situated to the south of a high pressure system over the western Atlantic, the cyclone moved slowly and erratically over the next day, heading generally westward. Late on September 28, the cyclone's center suddenly moved rapidly southwestward, coming closer to the deep convection. As a result, organization increased, and the system was upgraded to Tropical Storm Joaquin. Shear lessened on September 29 while the cyclone was situated over very warm waters. As a result, Joaquin began a period of fairly rapid strengthening. Deep convection slowly became more symmetric about the center, and the system reached strong tropical storm intensity that afternoon. Meanwhile, the ridge over the northeast Atlantic grew stronger, pushing Joaquin southwest toward the central Bahamas. Early on September 30, healthy outflow was established in the northern semicircle and the beginnings of an eye appeared on satellite imagery. As a result, the system was upgraded to a category 1 hurricane.

Joaquin's central pressure continued to plummet that day. Even though a stable eye had yet to appear on infrared imagery, cloud tops in the eyewall cooled significantly and the system became more symmetric overall. The outer bands of the system affected the central Bahamas during that morning as the storm approached. During the evening, Joaquin exploded in intensity to become a major hurricane, the most powerful of the season. By the morning of October 1, the center of the storm entered the central Bahamas. The cyclone made a little more progress southwestward that day, walloping the Bahamas with high winds, a sustained period of torrential rain, and substantial storm surge in some locations. That afternoon, Joaquin achieved category 4 status, reaching its peak intensity intensity of 130 mph winds and a minimum pressure of 931 mb. This was the lowest pressure observed in an Atlantic hurricane since Hurricane Igor in 2010. Early on October 2, Joaquin began its long anticipated turn toward the north and then northeast as a trough moving eastward over the United States began to influence its motion. Meanwhile, though Joaquin never directly affected the U.S. east coast, tropical moisture from the hurricane interacted with a frontal system moving eastward to bring immense amounts of rain to the Carolinas.

Joaquin finally moved away from the Bahamas later that day. The eye clouded over but reappeared again on October 3, causing some fluctuations between category 3 and 4 intensity. For a brief period that afternoon, the eye of Joaquin became very well-defined and winds were estimated to reach 155 mph, just under category 5 strength (these were the strongest winds by an Atlantic hurricane since Igor). However, the hurricane did not beat its previous minimum pressure. After this secondary peak, wind shear began to weaken Joaquin. Meanwhile, acceleration toward the north and east continued, and the system began to affect Bermuda as a category 2 hurricane on October 4. During the evening, around 8:00 pm EDT, Joaquin made its closest approach to Bermuda, passing about 65 miles to the west-northwest. The hurricane was close enough to bring tropical storm force winds and hurricane gusts to the island.

Wind shear abated while the system was still over marginally warm water overnight and through the morning of October 5, halting weakening at category 1 status. Joaquin continued to maintain a well-defined eye even as it gained latitude. On October 6, the hurricane turned northeastward and accelerated toward the open northern Atlantic. That night, the system began to lose tropical characteristics as it moved north of the Gulf Stream into colder waters and convection became asymmetric. It weakened to a tropical storm on October 8 and became post-tropical late that evening.


Joaquin was an unusually powerful hurricane for the El Nino conditions in which it formed. Anomalously warm ocean temperatures contributed to its intensity.


Hurricane Joaquin was very difficult to predict early in its lifetime, leading to large forecast errors in the extent of its southwestward motion and timing of its northeastward turn.

Friday, September 18, 2015

Tropical Storm Ida (2015)

Storm Active: September 18-27

Yet another tropical wave entered the eastern Atlantic on September 13, bearing generally westward south of the Cape Verde Islands. A low pressure center appeared in association with the system soon after. By the 15th, the disturbance assumed a more west-northwestward heading as the ridge to its north remained somewhat weak. Convection remained vigorous throughout the next few days, but the low was unable to take advantage of mainly favorable conditions. However, thunderstorm activity became much more concentrated near the center early on September 18, and the formation of Tropical Depression Ten followed later that morning. The depression strengthened into Tropical Storm Ida that night.

By the morning of September 19, the newly named tropical storm began to experience wind shear out of the northwest. Though banding features and deep convection remained healthy on the south and east quadrants, the center of circulation became exposed to the northwest. Over the next day, Ida continued to lose organization. During the afternoon of September 20, the cyclone's forward speed suddenly increased, but this trend was to reverse almost immediately as the storm approached an area of weak steering currents by that evening. Meanwhile, shear relaxed and Ida's convection came roaring back: a huge area of intense convection appeared and covered the center. As a result, the system began to strengthen.

However, this new trend was stopped by a new feature in the environment - a pronounced increase in mid-level shear. Throughout the day of September 21, the shower and thunderstorm activity slowly separated from the center. In addition, the lower- and upper-level centers themselves became separated, making the system difficult to pinpoint. By September 22, the influence of a large trough to the north of Ida caused it to cease progress towards the west-northwest and instead drift in the entirely opposite direction, toward the east-southeast. The havoc caused by the wind shear caused the system's circulation to fragment somewhat, with multiple low-level vortices evident as cloud swirls on satellite imagery west of the convective canopy. Overnight, as it hovered around minimal tropical storm strength, Ida even took an unusual southward turn. On September 23, however, the though began to carry Ida on a more steady path toward the east.

Though the trough began to move away from the system, the destructive influence of dry air and wind shear did not abate, causing Ida to weaken to a tropical depression on September 24. Shortly afterward, a ridge to the system's north forced it to switch directions again, this time to the north-northwest. The cyclone continued to persist in the face of unfavorable conditions, pulsating periodically with new convection. Therefore, it maintained tropical depression status into September 26. Ida's motion turned more toward the west that day and began to degrade further as bursts of shower activity became less frequent. By the afternoon of September 27, Ida had been devoid of convection so long that it no longer met the criteria for a tropical cyclone and degenerated into a remnant low. The low continued generally northwest for several days, even showing some signs of organization near the end of September. However, no redevelopment occurred and the system eventually merged with a frontal boundary.


The above image shows the disorganized tropical storm Ida over the central Atlantic.


Ida did not approach any landmass throughout its lifetime as a tropical cyclone.

Thursday, September 17, 2015

Tropical Depression Nine (2015)

Storm Active: September 16-19

On September 10, a tropical wave began to produce some shower activity as it moved off of the coast of Africa. Atmospheric conditions were initially unfavorable for any further development, but the system's environment improved on September 12, allowing it to organize. Meanwhile, it passed well south of the Cape Verde Islands, moving on a west-northwestward trajectory. On September 14, dry air interrupted the system's development and convection collapsed. The low associated with the system continued to persist and deepen, however, as upper-level winds remained low. After making a turn to the northwest, the system rebounded on September 16 and was classified Tropical Depression Nine.

Almost immediately after becoming a tropical cyclone, Nine entered an area of strong upper-level winds as it moved closer to an upper-level low to the northwest. Despite its convection being displaced well to the east of the center, Nine still managed a little strengthening early on September 17. In the midst of powerful wind shear associated with the strong El Nino event, the depression did little besides generate limited convection east of the center throughout that day and the next. By September 19, the system had become devoid of convection for the final time and the circulation became elongated along the southeast-northwest axis. Shortly afterward, the system lost tropical cyclone status. Its remnants continued generally northwestward until losing their identity.


Tropical Depression Nine was at its most organized immediately after formation (as shown above) while it remained in an environment that supported development.


The above image shows the track of Nine.

Wednesday, September 9, 2015

Tropical Storm Henri (2015)

Storm Active: September 8-11

On September 7, a low pressure system formed near the tail of a stationary front situated over the central Atlantic, well to the southeast of Bermuda. Despite inhibitive upper-level winds, the system began to produce a concentrated area of shower and thunderstorm activity while it remained nearly stationary. The low became better defined on September 8 and though convection was largely confined to the eastern side of the circulation, it had acquired enough organization that night to be classified Tropical Depression Eight. At the time of its classification, Eight had a large area of maximum winds and some other subtropical characteristics, but was more tropical than subtropical.

Though the satellite presentation remained extremely disorganized, with a broad circulation barely in contact with thunderstorm activity to the east, the system's maximum winds did increase somewhat over the next day and Eight was upgraded to Tropical Storm Henri late on September 9. Soon after, the cyclone began to move northward as the ridge holding it place slowly eroded. It passed well east of Bermuda during the morning of September 10, accelerating toward the north as it did so. Wind shear relaxed later that day, but the poorly organized system, still battling incursions of dry air, was unable to take advantage and remained at minimal tropical storm strength. The circulation became elongated by September 11 with multiple low-level swirls evident on satellite imagery. Henri lost its well-defined center during that afternoon and degenerated into a trough. Its remnants merged with a frontal boundary the next day.


Never in its lifetime did Henri develop any convective structure that circumnavigated the center of circulation. This contributed to its inability to significantly intensify.


Henri (and its progenitor system) remained stationary for a few days due to a ridge to the north before an incoming front allowed it to accelerate poleward.

Saturday, September 5, 2015

Tropical Storm Grace (2015)

Storm Active: September 5-9

Yet another tropical wave moved off of the coast of Africa on September 3, exhibiting signs of organization shortly thereafter. By the next day, the system developed a vigorous circulation, but lacked a closed circulation. However, as it moved past the Cape Verde Islands to the south on September 5, the disturbance gained enough organization to be classified Tropical Depression Seven. Just a few hours later, Seven intensified into Tropical Storm Grace over the eastern Atlantic. Deep convection remained limited over the next day as dry air tried to invade the circulation, but the system gradually deepened nonetheless through the day of September 6, reaching its peak intensity of 50 mph winds and a central pressure of 1002 mb.

A strong subtropical ridge maintained Grace's rapid westward motion as shear out of the west-southwest began to increase later that day. This shear impeded the outflow and convective banding of Grace, and began to induce weakening during the morning of September 7. The system maintained some deep convection through the morning of September 8, but it lacked any organizational structure; by this time, Grace had weakened to a minimal tropical storm. It weakened further into a tropical depression later that day as it entered a more stable airmass hostile to thunderstorm formation. By the morning of September 9, Grace was little more than a swirl of low clouds. Shortly afterward, it lost closure entirely and degenerated into a tropical wave. Moisture associated with Grace eventually reached the Caribbean islands a few days later.


Grace never exhibited much convective organization, remaining a weak tropical storm (as shown above) for most of its short lifetime.


As with Danny and Erika before it, Grace formed over the east Atlantic but ultimately suffered its demise amidst the harsh El Nino atmospheric conditions of the Caribbean and central Atlantic.

Sunday, August 30, 2015

Hurricane Fred (2015)

Storm Active: August 30-September 6

On August 27, the National Hurricane Center began to monitor a disturbance that was still well inland over the west African coast for tropical development. By the time it entered the Atlantic early on August 29, the system already had a well-defined circulation and convection increased immediately. Though initially very far south, the disturbance was able to gain latitude after moving over water due to a weakness in the subtropical ridge north of the Cape Verde Islands. Early on August 30, the circulation became well-defined, indicating the formation of Tropical Depression Six. Surrounded by warm water and low wind shear, the depression intensified shortly after its classification, becoming Tropical Storm Fred just a few hours later. Fred was named at longitude 18.9°W, only the fourth Atlantic system to be named east of 19°W.

The system continued to strengthen quickly during the day, exhibiting healthy outflow and a dense area of central convection. Meanwhile, its outer bands began to affect the Cape Verde Islands, bringing wind and rain as well as a storm surge to the islands. Overnight, Fred began to develop an eye, and was upgraded to a hurricane. The system began to pass through the Cape Verde Islands as a category 1 hurricane during the morning of August 31, becoming the strongest known to affect this area for over a century. While near the islands, Fred reached its peak intensity of 85 mph winds and a central pressure of 986 mb. Immediately after passing the northern islands that afternoon, however, the system encountered less favorable conditions including higher shear and lower atmospheric instability. Thunderstorm activity diminished rapidly overnight, and Fred weakened to a tropical storm.

The system held its own during the day of September 1 even as sea surface temperatures declined. Meanwhile, the ridge north of Fred began to rebuild, causing a more west-northwesterly motion. During the evening, however, Fred moved into an area of powerful wind shear out of the west that tore the entire convective canopy away from the surface circulation. Only a swirl of clouds was left of the system during the morning of September 2, with any significant thunderstorm activity now displaced over 100 miles to the east. Despite hostile conditions, a little bit of activity managed to redevelop near the center of Fred late that afternoon and it was able to maintain tropical cyclone status. In fact, it even strengthened slightly early on September 3. A cycle began that day in which Fred would lose its thunderstorm activity in the face of strong upper-level winds, recover with a new convective burst, and lose it again in a few hours. In this way, the system clung to life as a tropical cyclone for two full days as it tracked slowly west-northwestward towards warmer waters. Later on September 6, the system began to move northward into a weakness in the subtropical ridge and slowed its forward motion. Later that day, Fred weakened to a tropical depression. On September 7, though shear relaxed slightly, the circulation became elongated and soon lost its definition. The system dissipated late that afternoon.


This image shows Hurricane Fred at peak intensity before it entered a region of more stable air and weakened.


Fred formed almost immediately after entering the Atlantic and passed directly over the Cape Verde Islands as a category 1 hurricane, an extremely rare event.

Tuesday, August 25, 2015

Tropical Storm Erika (2015)

Storm Active: August 24-29

Around August 20, a tropical wave moved off of the African coastline. It passed just south of the Cape Verde islands shortly afterward, and moved swiftly into the central Atlantic. A low pressure center soon developed along the wave, and it begin to organize in earnest by August 23. The next day, the system acquired enough definition to be considered a tropical cyclone. Since an Atlantic buoy measured gale force winds near the center, it was classified Tropical Storm Erika.

Erika initially struggled with moderate wind shear and dry air aloft. On August 25, the center became exposed as convection retreated into the southeast quadrant. However, thunderstorm activity made a comeback overnight as the system approached the Leeward Islands from the east. Conditions deteriorated in the islands that night, for while Erika still possessed no visible banding features and was poorly organized, it packed a large area of heavy rainfall and thunderstorm activity. The center reformed to the south during the morning of August 27 as Erika entered the Caribbean.

Continuing to struggle with strong shear, the system remained badly organized that day, and though it passed fairly close to Puerto Rico from the south, most of the strongest winds remained in the southeastern quadrant over open water. By the morning of August 28, Erika had turned west-northwestward toward the island of Hispaniola. Later that day, the cyclone moved ashore on the south coast near the border of the Dominican Republic and Haiti, bringing scattered areas of heavy rain and tropical storm force winds. Land interaction weakened and disorganized the system further, making the center tremendously difficult to locate overnight. Though the circulation emerged over water, the system could not recover and Erika dissipated during the morning of August 29 near Cuba. The remnants of Erika continued toward the northwest, bringing rain to Cuba and eventually Florida. Moisture associated with Erika also contributed to thunderstorm activity over the Carolinas during the final days of August.


Erika failed to achieve significant organization due to constant vertical wind shear. The above image shows Erika over the Lesser Antilles.


Erika dissipated on August 29; the last several points of its track indicate the positions of its remnants over the following day.

Tuesday, August 18, 2015

Hurricane Danny (2015)

Storm Active: August 18-24

At the beginning of the third week of August, a the most vigorous tropical wave of the season thus far moved off of the African coastline. The system developed a surface low pressure center almost immediately. The low moved westward, tracking well south of the Cape Verde Islands early on August 16. Within two days, the low had acquired a closed circulation, and was classified Tropical Depression Four. Low shear conditions dominated the central Atlantic at the depression's low latitude (near 10°N) and the system strengthened to Tropical Storm Danny within hours.

The system experienced modest strengthening through the morning of August 19, but the center became exposed during the day as Saharan dry air infiltrated the northern half of the circulation. Meanwhile, a weakness in the ridge north of Danny allowed it to slow its forward motion and turn toward the west-northwest. Overnight, the cyclone's convective structure recovered, and a small area of concentrated thunderstorm activity appeared near Danny's center by the morning of August 20. Later that morning, an eye formed at the center of the system and Danny rapidly intensified into a category 1 hurricane, the first of the season. After its reformation, the structure of the system was very compact: tropical storm force winds extended only about 50 miles from the center, and hurricane force winds only 10 miles.

Surrounded by a low-shear environment and recovered from its encounter with dry air, Danny continued to strengthen over the next day. A period of rapid deepening brought the hurricane to its peak intensity as a category 3 major hurricane during the afternoon of August 21, with sustained winds of 115 mph and a central pressure of 974 mb. After attaining this peak intensity, however, wind shear increased and the system's cloud pattern decayed. Danny had become a minimal hurricane by the afternoon of August 22 and weakened to a tropical storm overnight. Meanwhile, the ridge north of the cyclone reformed, turning its motion back toward the west and increasing its forward speed. On August 23, Danny's center became exposed, and it became a minimal tropical storm that night. The system finally reached the Caribbean the morning of August 24, passing near Guadeloupe now as a tropical depression. By late that morning, Danny had lost its closed circulation and degenerated into a trough of low pressure in the far eastern Caribbean. Its remnants continued to spread areas of heavy rain westward over Puerto Rico on August 25 before fading away.


The above image shows Danny on August 21 when it briefly attained major hurricane intensity.


Danny dissipated on August 24, just as it entered the Caribbean Sea.

Monday, July 13, 2015

Tropical Storm Claudette (2015)

Storm Active: July 13-14

Late on July 11, a low pressure center moved off of the coast of North Carolina and entered the Atlantic Ocean. Thunderstorms became more concentrated near the low when its circulation encountered warm water early on the 12th, but the system was not yet tropical. Relatively low wind shear allowed the system to organize as it tracked northeast over the next day. By the afternoon of July 13, it had lost its frontal characteristics and was named Tropical Storm Claudette.

As Claudette accelerated away from land, conditions became unfavorable almost immediately as wind shear significantly increased. By the evening, thunderstorm activity was confined to the northeastern quadrant. Over the next day, the tropical storm steadily weakened from its peak intensity of 50 mph. The circulation was devoid of significant convection by the evening of July 14 and the cyclone became post-tropical.


Shortly after becoming a tropical cyclone, Tropical Storm Claudette began to experience strong shear that exposed the center.


Claudette formed from a frontal low that originated over North Carolina.

Tuesday, June 16, 2015

Tropical Storm Bill (2015)

Storm Active: June 15-20

On June 12, disorganized thunderstorms began to appear in the northwestern Caribbean and the neighboring areas of Belize and the Yucatan Peninsula. The trough of low pressure associated with the activity moved northwest over the Yucatan Peninsula the following day and deepened, producing a well-defined arc of convection extending into the Gulf of Mexico. By June 14, the disturbance was generating gale-force winds but had not yet acquired a well-defined circulation. Vigorous storm activity continued as the system moved into the Gulf. Atmospheric conditions improved in the vicinity of the disturbance on June 15 and it became more concentrated. Since tropical storm force winds were already occurring on the eastern side of the circulation, the system was designated Tropical Storm Bill late on June 15.

Through the morning of June 16, an area of high pressure over the southeastern United States steered Bill quickly towards the coast of Texas. The storm experienced slight strengthening, reaching its peak intensity of 60 mph winds and a central pressure of 997 mb before making landfall in the central Texas coast just before noon (local time). Bill weakened over land but maintained a well-defined circulation that was very prominent on radar imagery. The system turned northward that night and continued to bring flooding rains to Texas and Oklahoma as it moved inland and weakened to a tropical depression on June 17.

Tropical Depression Bill weakened only gradually over the next few days, maintaining its identity remarkably well even hundreds of miles inland. It turned slowly toward the east, moving through Oklahoma and Arkansas on June 18 and into Kentucky and Missouri the following day. 3 to 6 inches of rain were recorded along the first states in Bill's path and totals from 2 to 4 inches continued over a wide swath around the center over the east-central United States. On June 20, Bill finally became post-tropical and began to produce severe thunderstorm activity across the mid-Atlantic region as it interacted with a frontal boundary.


The above image shows Tropical Storm Bill just after landfall in Texas.


Despite spending less than two days over water as a tropical cyclone, Bill persisted far inland. This was in part due to the wet soil along its path (there had been a good deal of rain before Bill) that provided moisture to fuel the cyclone's circulation. This phenomenon is also known as the "brown ocean effect."

Thursday, May 14, 2015

Professor Quibb's Picks – 2015

My personal prediction for the 2015 North Atlantic Hurricane Season (written May 13, 2015) is as follows:

9 cyclones attaining tropical depression status*,
7 cyclones attaining tropical storm status*,
3 cyclones attaining hurricane status, and
1 cyclone attaining major hurricane status.

*Note: Tropical Storm Ana formed on May 8, almost a month before official start of the hurricane season and before I published my predictions.

The above prediction anticipates a significantly below-average hurricane season, particularly relative to the past few decades. It calls for just over half the typical number of tropical storms, and less than half of the usual hurricanes and major hurricanes. If this prediction were to come true, 2015 would be the least active season since 1994.

Several factors are stacked against tropical cyclone formation this season. First, a weak El Nino event that developed in 2014 has persisted so far this year. In addition, predictions indicate that it will strengthen over the coming months. Already, the anomalously high sea surface temperatures in the Pacific associated with an El Nino have caused a stronger jet stream and stronger wind shear across the United States and the neighboring Atlantic.

The relative scarcity of Atlantic hurricanes over the 2013 and 2014 seasons also suggests that we finally may be entering the "cool phase" of the Atlantic Multi-Decadal Oscillation (AMO), an apparent cycle of above-normal and below-normal hurricane activity whose period is measured in decades. We do not completely understand this cycle and cannot predict it, but the elevated activity for the 15 years ending in 2012 and the subsequent lull could indicate a reversal. Currently, cool water temperatures abound throughout the tropical Atlantic, supporting the hypothesis that we are entering a "cool" period. Regardless, the low Atlantic sea surface temperatures will help to suppress cyclone formation.

Finally, sea-level pressures over areas of the north central Atlantic have been higher than normal over the past few months. Though I wrote elsewhere that a stronger high-pressure system over the central Atlantic tends to steer Atlantic hurricanes towards land and that the strong high appears with the La Nina, and not the El Nino, the truth is more complicated. Both its position and strength influence hurricane activity in different ways and the latter may not correlate with the ENSO cycle. This year, there is both an El Nino and a higher intensity Bermuda high, and both of this factors tend to reduce hurricane activity.

My estimated risks for different parts of the Atlantic basin are as follows (with 1 indicating very low risk, 5 very high, and 3 average):

U.S. East Coat: 1
A combination of a strong jet stream and cool ocean waters will result in a very low risk of landfall for the U.S. East Coast. Ironically, Tropical Storm Ana made landfall in South Carolina before the season even officially began. However, this was due to a blocking pattern that should occur only infrequently, particularly if the El Nino strengthens.

U.S. Gulf Coast/Northern Mexico: 3
The anomalies in water temperatures are less pronounced in the Gulf of Mexico, so this region is at greater risk for landfalling cyclones. The Bay in Campeche in particular may be a birthplace of one or more short-lived tropical storms this season.

Yucatan Peninsula and Central America: 3
The high sea-level pressures this season will enhance trade winds, causing the potential for westward-tracking, fast-moving systems through the central Caribbean and into the Central American states. Despite the expected quiet season, this region will have about average risk.

Caribbean Islands: 2
The Caribbean can expect some activity, but El Nino-related dry air may lead to the demise of some tropical systems before they can undergo much strengthening. This region probably has little to fear from Cape Verde-type strong hurricanes this year.

Overall, the 2015 season is expected to be quiet, and possibly historically quiet. The precise strength of the developing El Nino is the main uncertainty in predicting the level of activity. Regardless, even quiet years can have devastating storms, so be sure to always practice hurricane preparedness!

Sources: http://www.cpc.ncep.noaa.gov/products/analysis_monitoring/enso_advisory/ensodisc.pdf, http://hurricane.atmos.colostate.edu/Forecasts/2015/apr2015/apr2015.pdf, http://www.tropicalstormrisk.com/docs/TSRATLForecastApr2015.pdf, http://www.ssd.noaa.gov/PS/TROP/TCFP/atlantic.html

Tuesday, May 12, 2015

Hurricane Names List – 2015

For the North Atlantic Basin, the list for naming tropical cyclones in 2015 is as follows:

Ana (used)
Bill (used)
Claudette (used)
Danny (used)
Erika (used)
Fred (used)
Grace (used)
Henri (used)
Ida (used)
Joaquin (used)
Kate (used)
Larry
Mindy
Nicholas
Odette
Peter
Rose
Sam
Teresa
Victor
Wanda

This list is the same as the list for the 2009 season because no names were retired that year.

Friday, May 8, 2015

Tropical Storm Ana (2015)

Storm Active: May 8-11

During the first few days of May, a stationary front stalled over the northwest Caribbean sea, extending through the Bahamas. By May 5, an upper-level trough had formed over the central Bahamas, generating a widespread area of showers and thunderstorms extending into eastern Florida. A weak surface low formed in association with the trough the next day and moved close to the Floridian coast. Due to a blocking pattern situated over the mid-Atlantic states, the low moved little over the next few days, drifting only slowly northward. Meanwhile, the low deepened over the warm Gulf stream waters southeast of the Carolinas. By May 8, the system was exhibiting gale force winds in a broad region encompassing its center as it meandered a few hundred miles off of the South Carolinian coastline. Late that night, the low acquired enough convective organization to initiate advisories, but the large radius of maximum winds led to its classification as Subtropical Storm Ana.

Despite relatively favorable sea surface temperatures, dry air impeded development of convection near the center of Ana over the next day. Through most of the day May 8, almost all thunderstorm activity was confined to the southern and eastern portions of the system's circulation and the center remained isolated. This also contributed to Ana remaining a subtropical cyclone that day as it moved little. During the night, significant cloud cover finally developed near the center and the broader structure disappeared, indicating that Ana had transitioned to a tropical storm early on May 9. By this time, it had acquired a slow north-northwestward motion towards the U.S. coastline. During the day, convective banding structure improved, but Ana simultaneously began to move over the cooler water nearest to the coastline. As a result, cloud tops warmed, though the system maintained its approximate peak intensity of 60 mph winds and a minimum pressure of about 998 mb. Meanwhile, bands of rain began to move into parts of the Carolinas. Overnight, Ana weakened as it interacted with the aforementioned cooler water and land, but made landfall just south of the border between the Carolinas at 6:00 am EDT, May 10, still as a tropical storm.

The cyclone quickly weakened to a tropical depression over land and began to move toward the north and north-northeast as the ridge over the mid-Atlantic shifted eastward and diminished. By May 11, Ana was well-inland over North Carolina but still maintained its identity as a weak tropical depression. Late that night, Ana degenerated into a remnant low over eastern Virginia. The low was absorbed soon after. Ana became the second-earliest cyclone to make a landfall in the United States when it did so on May 10, behind only a cyclone of February 1952.


The above image shows Ana approaching the United States coastline on May 9, just after transitioning to a tropical storm.


Ana stalled southeast of the Carolinas due to a blocking ridge situated to its north.

Wednesday, April 15, 2015

Annular Tropical Cyclones

An annular tropical cyclone is a tropical cyclone (various types of which are hurricane, typhoon, tropical storm, or simply cyclone, depending on location and intensity) with certain distinguishing structural characteristics. These characteristics not only affect the appearance of the tropical cyclone but also its evolution and interaction with the surrounding environment.

The word "annular", meaning "ring-shaped", describes the shape of this type of system. The image below demonstrates the visual differences between ordinary and annular tropical cyclones.


The top image shows a "normal" tropical cyclone, Hurricane Igor of 2010. The bottom image is Hurricane Isabel of 2003, during an annular stage. Though the cyclones were of comparable intensities, they differ greatly in structure. A typical powerful tropical cyclone will have a relatively small eye and spiral rain bands emanating far from the center of circulation. Annular tropical cyclones, on the other hand, have large, symmetric eye features, and are almost perfectly circular. In addition, they tend to be smaller and more compact than other cyclones (the images above are not to the same scale).

Annular tropical cyclones were not recognized as a distinct category until 2002, at which time the concept was introduced in a paper (see here). This idea was created in an effort to explain a class of cyclones which not had a different appearance but also had a notorious tendency to defy prediction, especially intensity forecasting.

In an effort to objectively define whether a given tropical cyclone is annular, researchers developed an algorithm to measure the characteristics of annular tropical cyclones. Using satellite data to measure cloud heights, eye radii, and the like, the algorithm takes a satellite image of a cyclone and outputs a numerical value: the annular hurricane index. If this value is less than zero, the cyclone is non-annular, but if the value is greater than zero, it is annular.

Since the algorithmic method derives a numerical value from a still satellite image, it follows that the index may change with time, and thus that a single tropical cyclone may at one time be annular and at other times not. This reflects observational intuition: weak cyclones by their very nature do not have the symmetry and eye structures which factor into the annular hurricane index. Being annular is a phase of a tropical cyclone's evolution, not an inherent property of a cyclone, and cyclones can further be annular at different intensities and for different durations.


The above image appears in the paper introducing the annular hurricane index (see here for the source). It shows several stages of evolution of a single hurricane, once again Hurricane Isabel of 2003. The different colors on the infrared images indicate various cloud top temperatures. The cooler a cloud top, the higher its altitude, and (roughly) the stronger the storm at that location. In the first image (from September 11), the strengthening category 4 Isabel still possesses visible banding features to the south and east and is notably asymmetric, resulting in a negative annular hurricane index. By the second image on September 12, Isabel was a category 5 hurricane, had lost all bands, and was close to circular in structure. With an index of 1.58, the cyclone met the criteria of an annular cyclone on this date. The third image, taken September 14, shows the hurricane, still a category 5, with quite circular cloud coverage and still little banding. However, the distribution of the coldest cloud tops is asymmetric, resulting in a slightly negative index for this date. By September 18, the hurricane had weakened to a category 2, and some dry air had invaded the system. The spiral structure contributed to the index being far below zero for this date.

Annular tropical cyclones also intensify and weaken quite differently from typical cyclones. While on intensifying trends, typical hurricanes and typhoons will often fluctuate in intensity once they reach major hurricane wind speeds (111 mph and up). The cause of this phenomenon is called the eyewall replacement cycle.


An eyewall replacement cycle is a process during which the eyewall (the ring of strong thunderstorms surrounding the eye) of a cyclone contracts, dissipates, and is replaced by another. The image above, from the Hurricane Research Division of the NOAA, illustrates such a cycle in the evolution of Hurricane Wilma, the most intense Atlantic hurricane ever recorded. The top row shows a series of visible satellite pictures, the second row infrared images, and the bottom vertical cross-sections through the center of the hurricane, showing approximate cloud heights.

The first column illustrates Wilma's compact eye at the time of its record peak intensity on October 19. In the second column, taken October 20, a new ring of clouds, the secondary eyewall, has completely surrounded the first. When this occurs, the first eyewall loses access to moisture and weakens, causing the eye to visibly cloud over just as it does in the second column. With a less-defined center of circulation, the maximum winds decrease and the pressure rises (in this case, Wilma weakened from a category 5 to a category 4). By the third image (from October 21) the first eyewall has dissipated completely, and the secondary wall has become the new primary one, causing the intensity of Wilma to level out (at least temporarily).

However, annular cyclones generally do not experience eyewall replacement cycles, instead maintaining their characteristic large, circular eyes for days at a time. This property exemplifies a more general trend: annular cyclones respond less to changes in their environment than regular tropical cyclones. In particular, having reached their peak intensity, they, in the absence of very cold water or land interaction, tend to weaken only very slowly.


The above graph compares annular hurricanes (6 cases) and other Atlantic hurricanes (56 cases) that did not encounter especially hostile conditions (again, land and very cold water). The intensity trends of the cyclones were averaged and normalized, so that a v-value of 1 corresponds to the peak intensity of a cyclone. Notably, annular hurricanes strengthen slightly more slowly and weaken significantly more slowly than their ordinary counterparts. Examples include 2014's Hurricane Iselle in the Pacific, which maintained hurricane intensity over marginal sea surface temperatures much longer than expected by forecasters. Iselle ultimately made landfall in Hawaii as a tropical storm, a very rare occurrence.

Annular cyclones form a very distinct class of cyclones that exhibit abnormal behavior. Though we do not yet fully understand how and why these cyclones form and act as they do, we continue to make advances in their identification and prediction, including the development of the annular hurricane index. Further research will help us comprehend these cyclones and more adequately prepare for them.

Sources: http://journals.ametsoc.org/doi/pdf/10.1175/2007WAF2007031.1, http://rammb.cira.colostate.edu/resources/docs/annular_Knaff.pdf, http://earthobservatory.nasa.gov/IOTD/view.php?id=45780, http://en.wikipedia.org/wiki/Annular_tropical_cyclone, http://www.nhc.noaa.gov/archive/2014/ep09/ep092014.discus.013.shtml?, http://www.aoml.noaa.gov/hrd/tcfaq/D8.html

Sunday, March 22, 2015

Cosmic Rays 3

This is the final post in a series on cosmic rays. For the first, see here.
We began by showing another graph of the cosmic ray flux at various energies.


It so happens that this graph very nearly follows an inverse cube relationship (which appears straight on log-log graphs). That is, cosmic rays with double the energy are about eight times rarer in the cosmos. The above diagram also shows the small deviations from the inverse cube relationship that occur at high densities, known as the "knee" and the "ankle".

The first major deviation from the inverse cube law, the so-called "knee", occurs around 1015 eV. Theoretically, this is near the maximum energy that a charged particle could have and still be contained in the Milky Way by the galaxy's galactic halo. The Earth receives a slightly larger flux of these energies than expected because particles slowed to this energy remain in the Milky Way while higher energy particles do not. The transition to extragalactic particle origins forms the "ankle" of the graph.

Extragalactic Cosmic Rays

Cosmic rays with energies more than about 1015 electron volts seldom, if ever, originate in our galaxy. Such cosmic rays could originate from particularly powerful supernovae, or, accelerated by the same mechanism of magnetic shock waves, from two colliding galaxies. However, it is likely that most cosmic rays originate in active galactic nuclei, such as quasars.


The above is an artist's rendering of a quasar. As the name suggests, quasars are very similar to microquasars, except much larger (similar features include the accretion disk and relativisitic jets, both illustrated above). The compact object involved, rather than being a neutron star or stellar black hole, is a supermassive black hole, the kind found at the center of most galaxies (including the Milky Way). Such black holes often exceed one million solar masses.

The characteristic property of active galactic nuclei is that they consume matter at an extraordinarily rapid rate. As a result, the energy and radiation released far outshine the rest of the galaxy. In fact, many quasars are hundreds or thousands of times more luminous than our entire Milky way, corresponding to a luminosity sometimes exceeding a trillion suns. However, over time, the supermassive black hole consumes all nearby matter, and the galaxy becomes dormant, becoming in many respects like our own. For this reason, quasars tend to be young galaxies, and thus the ones we see tend to be quite distant (that is, we see them as they were a long time ago). Even the nearest quasars are still billions of light-years away.

Cosmic rays from these distant quasars may have energies up to about 5x10¹⁹ eV (50 million trillion eV). However, this value is the theoretical upper-limit for the energy of cosmic rays from distant sources, also known as the Greisen-Zatsepin-Kuzmin Limit (GZK limit). Computed independently in the 1960's by Kenneth Greisen, Georgiy Zatsepin, and Vadim Kuzmin, the GZK limit comes about from the interactions between cosmic ray particles and the cosmic background radiation (see also here), the leftover radiation from shortly after the Big Bang which permeates the Universe. In theory, if cosmic rays with higher energy travel a sufficient distance, interactions with the cosmic background radiation will reduce them to the GZK limit.

However, this is not the end of the story. It has been confirmed that cosmic rays with even higher energies have hit the Earth, though such events are rare: cosmic rays with energy exceeding the GZK limit hit a given square kilometer of the atmosphere only about once per decade. The most commonly accepted explanation for these particles is that they have not yet traveled far enough for the cosmic background radiation to slow them down, and therefore come from sources within about 200 million light-years.

Recently, scientists have proposed that quasar remnants (galactic nuclei that were formerly active) could eject such particles, though being relatively quiet in electromagnetic emissions. Unlike quasars, so-called "retired quasars" are very common in our region of the cosmos, some within 100 million light-years. Very massive, rotating supermassive black holes are the most probable candidates for the origin of these cosmic rays.


The elliptical galaxy M60 (above) is one plausible source for cosmic rays with energies exceeding the GZK limit. The galaxy is only about 55 million light-years away, and harbors a supermassive black hole of 4.5 billion solar masses, among the largest known.

Likely the current record-holder for the most energetic cosmic ray ever observed was aptly named "Oh-My-God" particle. This particle (most likely a proton) was observed in Utah on October 15, 1991. It had an energy of approixmately 3x10²⁰ eV, roughly six times the GZK limit. Since this energy is about 50 J, it is comparable to the kinetic energy of a pitched baseball, all in a single particle! Upon Earth impact, this particle was traveling at roughly 99.99999999999999999999951% of the speed of light. However, the Oh-My-God particle, and other similar cosmic rays, are no threat to Earth or its indigineous life, due to their infrequency and their interactions with the atmosphere before reaching Earth's surface.

Nevertheless, studying the composition and energy of cosmic rays is very important to astrophysics. By observing cosmic rays in addition to collecting images using electromagneitc radiation, we obtain a more complete picture of our Universe.

Sources: http://www.cosmic-ray.org/reading/uhecr.html, http://www.boseinst.ernet.in/capss/doc/cosmic_primer.pdf, http://www.spaceflightnow.com/news/n0204/23quasars/, http://imagine.gsfc.nasa.gov/docs/features/news/22apr02.html, http://en.wikipedia.org/wiki/Oh-My-God_particlehttp://astronomy.swin.edu.au/cms/astro/cosmos/g/Greisen-Zatsepin-Kuzmin+Limit, http://arxiv.org/abs/0910.4168, http://science.gsfc.nasa.gov/662/boldt/BoldtSymp_Loewenstein.pdf

Thursday, February 26, 2015

Cosmic Rays 2

This is the second part of a two-part post about cosmic rays. For the first part, see here.

The first post dealt primarily with the composition of cosmic rays and the abundance of different types. The other major characteristic of cosmic rays is their energy.


The figure above illustrates the abundance of cosmic rays of different energies on a logarithmic scale. The x-axis shows the energy of cosmic rays in electron volts. An electron volt (eV) is a unit of energy, defined to be the energy required to move an electron through an electric potential of 1 volt. Protons, for example, the most common type of cosmic ray, have a rest energy of 9.38x10⁸ eV, at the bottom end of the chart above. Even at rest, protons are considered to have energy given by the mass-energy relationship E = mc2. Protons (and other cosmic rays such as atomic nuclei) of larger velocity have even greater energies.

The y-axis of the chart indicates cosmic ray flux. Flux, generally speaking, refers to the quantity of something passing through a given surface. In this case, the flux refers to the number of cosmic rays of a certain energy passing through a given area of the Earth's atmosphere. For example, (as labeled on the graph) "1 m-2 s-1" indicates that one cosmic ray passes through each square meter of the Earth's atmosphere (viewed as a spherical surface) every second.

The blue line indicates the relationship between the energy of cosmic rays and the frequency with which they impact Earth (measured by flux). The fact that the curve is decreasing represents that higher energy cosmic rays are rarer. Uncertainty in the values causes the curve to widen for higher energies.

Finally, the graph is separated into three sections, indicating the typical origins of cosmic rays of different energies. The leftmost zone, the yellow zone, refers to solar cosmic rays, i.e. those originating in the Solar System.

Solar Cosmic Rays

Solar cosmic rays, also known as Solar Energetic Particles (SEP's), have energies up to a few gigaelectron volts (~1010 eV). The Sun emits these particles during coronal mass ejections (CME), or explosions of the Sun's atmosphere.


The above image shows a solar flare, which is similar but distinct from a CME in that most radiation released in electromagnetic (the explosion is bright) rather than cosmic rays. Solar flares do release cosmic rays, but to a lesser extent. Mass ejections, on the other hand, release huge quantities of SEP's, some of which are acclerated to over half the speed of light (these have the greatest energies). These events can produce particles that can interfere with the performance of satellites by penetrating their outer skin. The volume of high-energy radiation produced by the strongest events, such as the CME of August 1972, would be fatal to a human outside of the Earth's magnetic field.

Very rarely do solar (and other) cosmic rays reach the surface of the Earth, and, when they do, there are too few to cause radiation damage. However, by the chart above, there is an average of about 1000 such particles impacting every square meter of the surface of the outer atmosphere (outside the magnetic field) every second. Thus, there is potential for satellite damage, especially when this value increases during CME's.

Galactic Cosmic Rays

Galactic cosmic rays (GCR's) are cosmic rays originating from outside the Solar System, but within the Milky Way galaxy. Though they may have energies similar to those of solar cosmic rays, they also may be more energetic, falling into the range 1010 eV to 1015 eV, as illustrated by the blue zone of the figure.

The primary sources for GCR's are supernova remnants; the magnetic fields of these supernovae may accelerate ejected particles to over 99.9% of the speed of light. Through a process known as diffusive shock acceleration, the shock waves of the magnetic field of an exploding supernova emits impart massive amounts of energy to accelerate charged particles. However, other objects, such as so-called microquasars, also produce very high energy cosmic rays.


Microquasars are compact objects, such as white dwarfs, neutron stars, or black holes (see here) which have an ordinary companion star in a binary system. The gravitational pull of these objects sucks plasma off of their companion stars, adding them to an accretion disk as shown. Though a process not entirely understood (but known to involve the magnetic fields of the compact objects) matter from the accretion disk is shot out of the polar regions into relativistic jets, so named for the extremely high speeds of particles therein. Cosmic rays in these jets may be extremely energetic, on the order of 1-1000 TeV (1012-1015 eV). An example of a microquasar in the Milky Way is Cygnus X-3, named for being the third brightest X-ray source in the constellation Cygnus.

An X-ray image of Cygnus X-3


Though Cygnus X-3 is the third brightest in X-rays from Earth, it is more distant than Cygnus X-1 and Cygnus X-2, at a distance of 37,000 light-years (though still in the Milky Way). Further, it emits some of the highest-energy cosmic rays known to originate in the Milky Way galaxy, up to 1000 TeV. Note that the most energetic artificially accelerated particles produced on Earth by the Large Hadron Collider (LHC) have energies on the order of 10 TeV. Since the Earth receives about one particle with energy 1000 TeV per square meter per year, our planet is constantly bombarded by particles moving faster than anything manmade particle colliders have produced.

The final category of cosmic rays (corresponding to the purple area of the figure above) is extragalactic cosmic rays. They are discussed in the final post of this series, coming March 22.

Sources: http://www.euronuclear.org/info/encyclopedia/r/rest-energy.htm, http://solarphysics.livingreviews.org/open?pubNo=lrsp-2006-2&page=articlesu15.html, http://helios.gsfc.nasa.gov/sep.html, http://preppercentral.com/wp-content/uploads/2013/11/sun-big-solar-flare.jpg, http://hesperia.gsfc.nasa.gov/sftheory/spaceweather.htm, http://hyperphysics.phy-astr.gsu.edu/hbase/starlog/cygx3.html#c1, http://helios.gsfc.nasa.gov/gcr.html, http://hyperphysics.phy-astr.gsu.edu/hbase/relativ/releng.html, http://www.andrewcollins.com/pics/cygx3_415k.jpg,

Monday, February 2, 2015

Cosmic Rays 1

The Earth constantly is bombarded with a large amount of radiation from the cosmos. Much of this radiation is electromagnetic, coming in the form of radio waves, microwaves, infrared rays, visible light, ultraviolet rays, X-rays, and gamma rays. All of these types, however, are composed of photons, massless particles which travel at the speed of light. Other subatomic particles also compose incoming radiation, falling into the umbrella of "cosmic rays".

We cannot take detailed images of the cosmos with cosmic rays like we can with electromagnetic radiation. This is because the particles composing this radiation are charged, and thus change direction and speed when influenced by the magnetic fields of the Sun and Earth. As a result, we cannot directly ascertain the direction from which these particles come. Nevertheless, cosmic rays help us understand the composition of objects in the cosmos. In addition, since the particles making up cosmic rays have mass, they often require huge amounts of acceleration to reach us. The fact that the particles reached Earth at all reveals clues about the nature of the objects from which they came.

Cosmic rays have two main characteristics: composition and energy. We explore each in turn.


Cosmic rays are generally composed of the nuclei of atoms, though other particles appear as well, such as electrons. The extreme energy and speed of these former atoms stripped them of their electrons, leaving positively charged nuclei and negatively charged electrons, each of which are influenced by magnetic fields, as described above. Of these types of particles, hydrogen and helium nuclei (protons and alpha particles), the lightest two elements, are by far the most abundant in cosmic rays. Further, the proportions of hydrogen and helium nuclei in cosmic rays, ~90% and ~9%, respectively, are very consistent with the proportion of atoms in the Universe which are hydrogen and helium.

The above diagram illustrates the relative abundance of the chemical elements (in increasing order) in the Universe, as estimated through indirect means such as spectroscopy, an observational method which uses facts about how different elements absorb and reflect light to discern the composition of celestial objects. Note the relative rarity of lithium, beryllium, and boron, despite the fact that these are very light elements (atomic numbers 3, 4, and 5). The reason for this lack is that these elements are not heavily produced during stellar fusion, occurring only as intermediates in nuclear reactions that either produce helium or heavier elements like carbon. However, the nuclei of these three elements compose 0.25% of cosmic rays, more than a million times greater than what we would expect from the Universe's composition!

It is believed that these elements are disproportionately represented in cosmic rays due to collisions between "original" cosmic rays containing protons and atoms in the interstellar medium, such as carbon or oxygen. Such interactions may produce energetic lithium, beryllium, or boron nuclei as a byproduct, and these particles subsequently reach Earth. The fact that the products of these collisions are energetic and thus more likely to reach Earth explains why these elements are disproportionally represented in cosmic rays. The nuclei of elements of higher atomic numbers also appear more frequently in cosmic rays than we would "expect" from the abundance graph above. This shows that cosmic rays tend to come from sources rich in heavy elements, such as supernovae.

Antiparticles also make infrequent appearances in cosmic rays. An estimated 0.01% of cosmic rays are composed of antimatter. In fact, cosmic rays led to the original discovery of antimatter. In 1928, Paul Dirac, using the mathematics of quantum theory, including Schrödinger's Wave Equation, predicted the existence of antimatter. Antimatter was at the time an undiscovered class of particles each of which would be an "opposite" counterpart to an ordinary particle (opposite in some properties, such as charge, but not in others, such as mass, which must always be positive or zero). One example is the antielectron, also known as the positron, which would have the same mass as the electron, but a positive, rather than negative, charge. This charge, through opposite, is of the same magnitude as the electron's. In 1932, Carl D. Anderson observed a cosmic ray composed of a positron, using a device known as a cloud chamber.

Antimatter, however, does not exist in abundance in the Universe. Matter and antimatter particles annihilate on contact, producing energy, so due to a slight matter-antimatter imbalance following the Big Bang (the origins of which are still unknown), the known Universe is dominated by matter. However, just as matter and antimatter particles can annihilate and form energy, energy may also spontaneously (during certain quantum interactions) be converted into a particle-antiparticle pair through a phenomenon known as pair production.


This diagram illustrates the formation of an electron (e-) and its antiparticle the positron (e+) from a gamma ray photon (γ). This instance of pair production often happens when a high-energy photon impacts the nucleus of an atom. The number of cosmic rays composed of antimatter which impact the Earth over a given period helps us to estimate the frequency of these reactions in space. Cosmic rays also often cause chain reactions in the Earth's atmosphere. In fact, this is how these rays are often detected.


The above image illustrates the cascade of particles that can occur when a cosmic ray (especially a powerful one) hits Earth's atmopshere. The interaction proceeds from top to bottom and begins when the cosmic ray impacts an atom (all atoms involved are denoted by circles). This produces several short-lived particles known as pions (with the symbols π+, π-, and π0 depending on the charge). The left branch indicates the decay of the neutral pion into gamma rays, each of which forms an electron-positron pair through pair production, (presumably through more interaction with atmospheric matter) releasing other gamma rays which do the same. The center shows the main decay mode of the pion into a muon (denoted μ) and a muon antineutrino (not shown) or the corresponding antiparticles (if the initial pion charge is reversed). Muons too decay after around 2.2 microseconds, leaving their characterisitc signiture of particles. Finally, the right branch indicates how incoming cosmic rays might impact and destablize atomuc nuclei. These nuclei then emit protons, neutrons, or tiny particles called neutrinos. Sometimes the emitted neutrons and protons hit other atoms, and the chain reaction continues.

The length of such a chain reaction depends on the energy of the original cosmic ray. Sufficiently energetic cosmic rays can cause huge chain reactions which reach the Earth's surface, allowing us to observe them. To see how energy affects the behavior of cosmic rays and can reveal more about their origins, see the next post.

Sources: http://helios.gsfc.nasa.gov/cosmic.html, http://imagine.gsfc.nasa.gov/docs/science/know_l1/cosmic_rays.html, http://hyperphysics.phy-astr.gsu.edu/hbase/astro/cosmic.html#c2, http://imagine.gsfc.nasa.gov/docs/science/know_l2/cosmic_rays.html, http://abyss.uoregon.edu/~js/glossary/cosmic_rays.html, http://www.algebralab.org/practice/practice.aspx?file=Reading_RelativeAbundanceElementsUniverse.xml, http://jtgnew.sjrdesign.net/stars_fusion.html, http://www.whoi.edu/cms/files/ksims/2006/10/Cosmo_lect_2006_4SPP_14851.pdf, http://cosmos.phy.tufts.edu/~zirbel/ast21/sciam/AntiMatter.pdf, http://neutronm.bartol.udel.edu/catch/cr2b.gif,

Friday, January 9, 2015

Madden-Julian Oscillation

The Madden-Julian Oscillation (MJO) is a periodic fluctuation of convective activity in the tropics that impact the activity of the monsoon and the formation of tropical cyclones in various basins throughout the world.

Near the equator, weather is more chaotic and less structured than at midlatitudes. At midlatitudes, large cyclones and, sometimes, attached frontal boundaries, govern weather patterns. However, the formation of the vortices of these cyclones requires an effect called the Coriolis effect. The Coriolis effect, in essence, induces rotation in midlatitude regions because the rotation of the Earth carries points at different latitudes at different speeds. But at the equator and the area immediately around it, this effect is not significant enough to cause rotation under usual circumstances. Thus weather patterns in the tropics are rather caused by undulations of the Intertropical Convergence Zone (ITCZ), which seemed to produce shower and thunderstorm activity randomly.

However, some evidence contrary to the idea that the fluctuations were random has been known since antiquity. India's weather, for example, includes clearly demarcated dry and wet seasons in association with the monsoon, despite the fact that southern India's weather is predominantly affected by the activity of the ITCZ. In the 1970's, when more meteorological data became available, scientists Roland Madden and Paul Julian, after whom the oscillation is named, noted that there was a recurring cycle between increased precipitation and suppressed precipitation in the tropics, particularly notable in the Indian Ocean and the Pacific Ocean. More data emerged over the coming years, revealing that the anomalies in tropical precipitation tended to follow the equator, moving east around the globe over time.

The areas of increased and decreased thunderstorm activity associated with the MJO span several thousand miles; in areas of increased activity, the MJO is said to be in positive phase, and in areas of suppressed activity, in negative phase. Each "phase" propagates eastward around the globe at 4-8 meters per second, and therefore takes 30-60 days to travel around the Earth. This time interval, though not an exact value, is the period of the MJO, or in other words, the time necessary for the precipitation anomalies to return to roughly their initial conditions. At any given time, there are about 1-2 areas of increased convection and 1-2 areas of decreased convection that span the tropics.


The above water vapor imagery from the NOAA shows a dry air mass over much of the central Atlantic and Caribbean. The increased tendency for dry air masses to appear in an area of the tropics is thought to correlate with the negative phase of the MJO.

The MJO, as well as governing the onset of the monsoon in India and other locations, can also have an effect on tropical development, even in the Atlantic and Pacific basins. Dry air is often devastating to tropical cyclones, invading their circulations and weakening or even dissipating them. Though some parts of the typical Atlantic and Pacific hurricane seasons are more active then others, in any particular season, the tropical cyclone activity may modulate with the MJO, increasing during positive phase and decreasing in negative phase. In support of this theory, it is a well documented fact that the Atlantic basin tends to be quiet when the Eastern Pacific basin is active and vice versa. This is because these neighboring basins tend to be experiencing opposite phases of the MJO at any given time.

The study and modeling of the MJO is very important to meteorology becuase this oscillation brings order to the chaos of tropical weather. Greater understanding of the MJO will aid long-term and large-scale forecasts, and improve our ability to antipicate tropical cyclonogenesis.

Sources: http://www-das.uwyo.edu/~geerts/cwx/notes/chap12/mjo.html, http://maddenjulianconversation.blogspot.com/2011/08/what-is-mjo-part-1.html, http://www.met.reading.ac.uk/~pete/mjo.html, http://en.wikipedia.org/wiki/Madden%E2%80%93Julian_oscillation, https://www2.ucar.edu/sites/default/files/news/2011/MJO_illus.jpg